LAB 4- Station Plots and Fronts

In this lab, we will discuss weather observing station plots as well as a brief look at fronts. Knowledge of how to read a surface weather map is essential for all meteorologists.

Station Plots

Station plots are a quick and easy way for meteorologist to visually view current weather data on a map. The station plots we will be looking at today are used for surface station plots only. The are different sets of rules for station plots of upper air data. Below, each station plot is broken into each of the variables in which it describes.

Temperature:

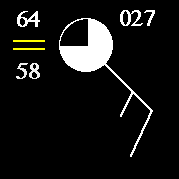
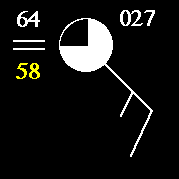
The value highlighted in yellow located in the upper left corner is the surface temperature measured in degrees Fahrenheit. In this example, the reported temperature is 64 degrees.

Weather Symbol:

The weather symbol highlighted in yellow indicates the type of weather occurring at the time the observation is taken. In this case, fog was reported. If there were thunderstorms occurring when the observation was taken, then the symbol for thunderstorms would have appeared instead.


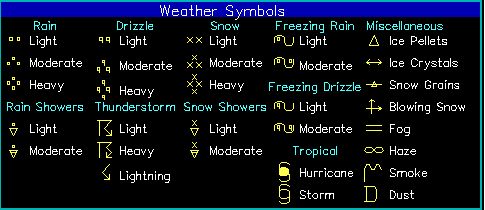
Here is a chart with some, but not all, of the weather symbols used to represent the current weather on surface station plots.

Dew Point Temperature:

The value highlighted in yellow located in the lower left corner is the dew point temperature in degrees Fahrenheit. In this example, the reported dew point temperature is 58 degrees.
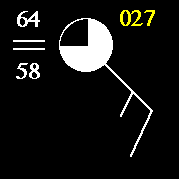
Cloud Cover:

The symbol highlighted in yellow indicates the amount of cloud cover observed at the time the observation is taken. In this case, broken clouds were reported. In our lab, we will report the cloud amounts in 8ths. In this case, the cloud cover would be 6/8, because 6/8 (or 3/4) of the circle is filled.
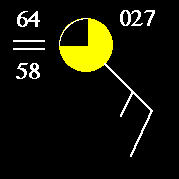
Sea Level Pressure:

The value highlighted in yellow located in the upper right corner represents the last three digits of the sea level pressure reading in millibars (mb). Surface pressures range from 960 mb to 1030 mb. On the surface station plot, either the 10 or the 9 has been dropped off of the measurement, and it is up to the meteorologist to figure out which one was dropped (by using common sense, and the normal range values). The pressures are given out to tenths of millibars. The surface pressure in the example is 1002.7 mb.
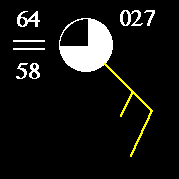
Wind Barb:

The symbol highlighted in yellow is known as a wind barb. The wind barb indicates wind direction and wind speed. The barb points in the direction from where the wind is coming from. In our example, there is a southeast wind. The wind speed is measured (in knots) by the number and type of flags on the bard. A short flag is 5 knots, long flag is 10 knots, and filled triangle is 50 knots. In our example, we have a short and a long flag, so the wind speed is 15 knots.

Cold Front

When colder air moves down (usually from the north) and takes over warmer air (usually in the south), the boundary between these colliding air masses is called a cold front. The temperature change along a cold front is usually around 20 degrees Fahrenheit, but it can be much more or less.


Ahead of a cold front, surface wind directions are usually from the south to southeast. Behind a cold front, the winds are usually from the north or northwest. A cold front is denoted on a surface map with a blue line with filled triangles along it. The triangles point to the direction in which the cold front is moving.


Here is a 3-D picture of a cold front. Notice how when the warm air colides with the cold air the warm air is lifted up and over the cold air and forms clouds. The warm ir is lifted because it is less dense than the colder air.


Warm Front

A warm front is just the opposite of a cold front. It is a boundary between advancing warmer air in to colder air. The temperature change across the front is also around 20 degrees Fahrenheit, but can be more or less as well.


Ahead of a warm front, surface wind directions are usually from the east or northeast. Behind the warm front, the winds are usually from the south or southwest. A warm front is denoted on a surface map by a red line with filled half circles. The half circles point to the direction in which the warm front is moving.


Stationary Front

A stationary front is when a cold air mass and a warm air mass are next to each other, but neither is moving anywhere. There still exists a noticeable temperature change across the boundary, but the surface winds are not pushing it either way.

Occluded Front

A occluded front, or occlusion, occurs when a warm air mass and a cool air mass come in contact with each other, making boundaries at both the ground as well as aloft. There are two types of occlusions (cold and warm) depending on whether cold air is colliding with the cooler (less cold) air or cooler (less cold) air is colliding with colder air. Warmer air is above the intersection of these two colder colliding airmasses.

For more information about fronts with diagrams, see P. 49 in your USA Today : The Weather Book.


Written by Brad Illston