Matlab Assignment 2
Brett Roberts
November 7, 2006
Figures
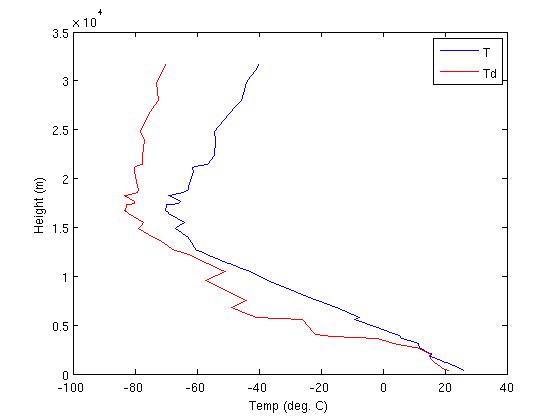
Temperature/Dew Point vs. Height
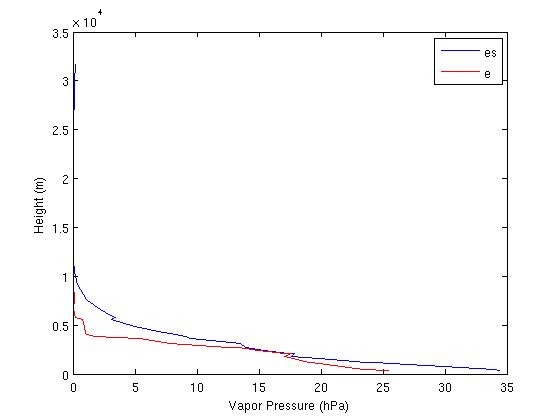
Vapor Pressure/Saturation Vapor Pressure vs. Height
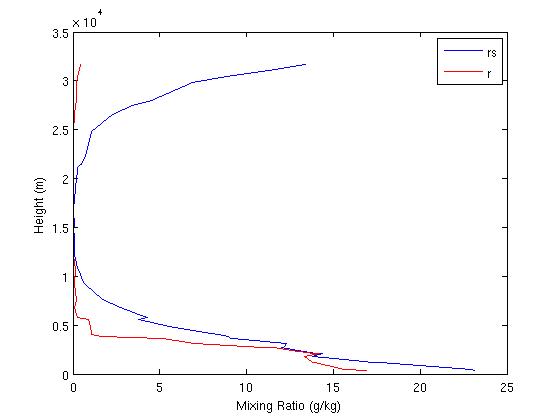
Mixing Ratio/Saturation Mixing Ratio vs. Height
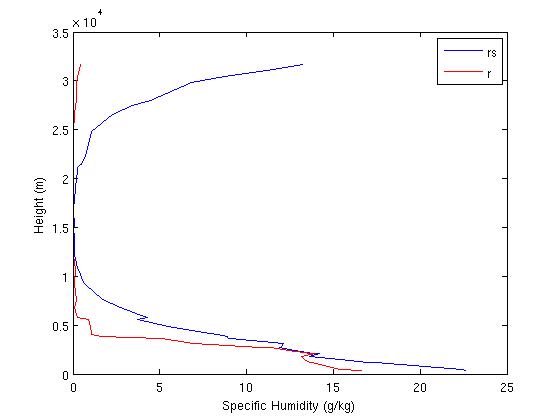
Specific Humidity/Saturation Specific Humidity vs. Height
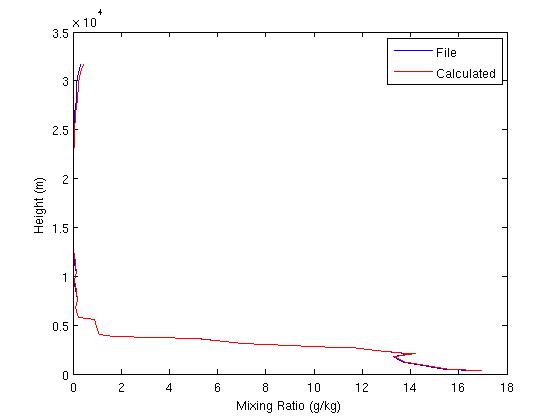
Mixing Ratio vs. Height, Calculated and Observed
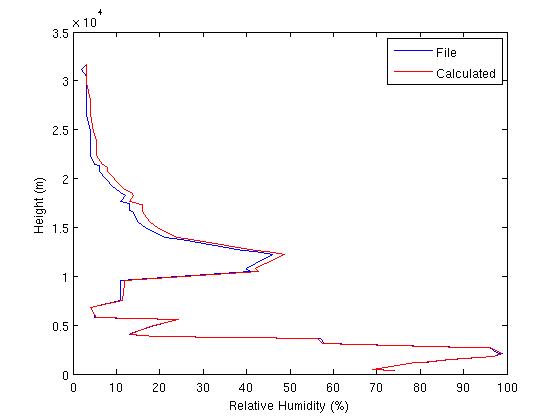
Relative Humidity vs. Height, Calculated and Observed
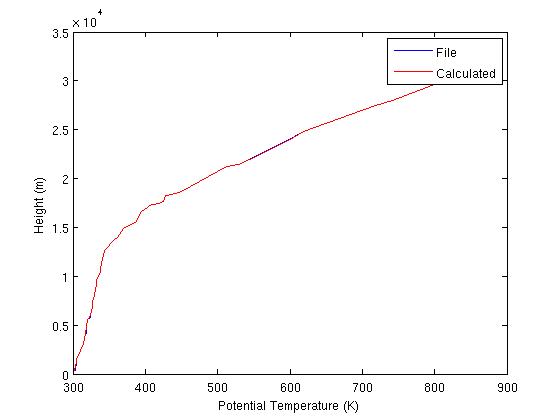
Potential Temperature vs. Height, Calculated and Observed
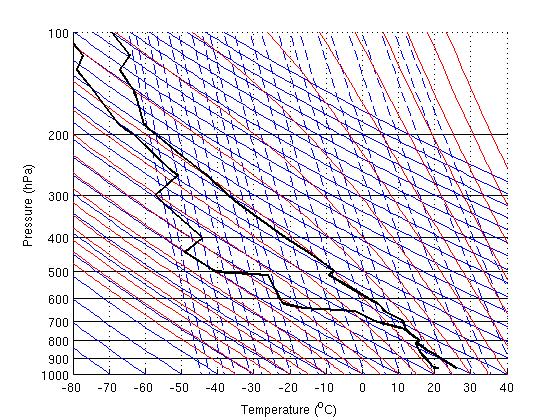
Stuve Diagram, Generated by University of Wyoming Page

Stuve Diagram, Plotted in Matlab
Questions
1. The lower-levels (surface to 700 mb) are conditionally unstable with environmental lapse rates between moist adiabatic and dry adiabatic, except for a few small
stable layers between 800 mb and 700 mb with lower lapse rates. The mid-levels (700 mb to 400 mb) are conditionally unstable throughout, except for a small inversion near the 500 mb
level. The upper-levels (400 mb to 100 mb) are generally stable with environmental lapse rates becoming less than moist adiabatic, and eventually negative at the tropopause.
2. The tropopause appears to be about 15 to 16 km above the surface on the T vs. H plot. This corresponds to about 130 mb on the Stuve diagram. It is somewhat
difficult to pinpoint the exact height of the tropopause because there are several inversion layers beginning at about 15 km before the temperature plot takes a permanent
turn towards negative lapse rates.
3. The U-WY Stuve plot displays a veering wind profile, suggesting warm air advection is occurring.
4. The RH plot suggests that clouds are present in a layer roughly between 2 km and 3 km above the surface. Using the Stuve plot, this
corresponds to a pressure level of roughly 800 mb to 730 mb. In this layer, the RH exceeds 90% and the observed moisture variables (r, e, q)
are nearly equal to their saturation counterparts (rs, es, qs), indicating probable saturation and condensation.
5. Cooling of the mid-levels would increase the instability of parcels being forced upward from the surface because of steepened lapse rates. A parcel being lifted
adiabatically from the surface to the mid-levels is more likely to be warmer than its surroundings, the condition for atmospheric instability, the cooler the environmental
mid-level temperatures are.
Back to Main