Fractal Math - page 2
Mandelbrot Set
The Mandelbrot set is a super-set of the Julia sets. Instead of plotting
different initial conditions for Z, we are now plotting results for
different values of C (in Z'=Z^2+C).
Using a magnification factor of 0.75 (and otherwise using default values for
the Julia set) we get the following image (click here for code):
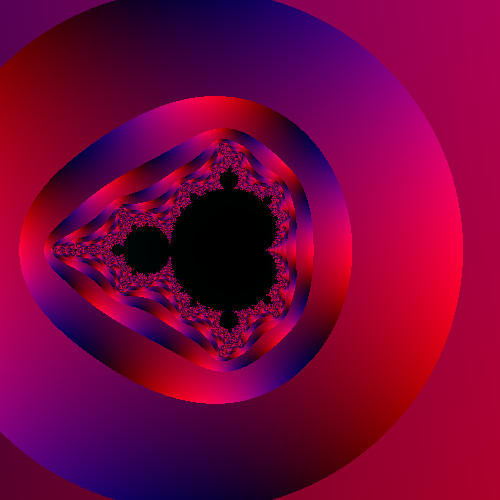
It is interesting to see that only a relatively confined area of phase
space is stable (black). As one proceeds away from this area, the
behavior becomes much less chaotic (i.e., small changes in C yield very
little change in final result).
Up until now, the breakout color scheme has assigned a purple value based
on the first (final) value outside the breakout threshold. Let's change
it so that the color is assigned according to the number of iterations it
takes to "escape" (click here for code):
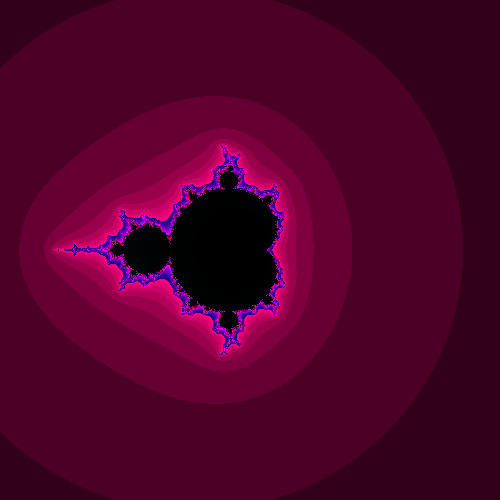
The brighter purple hues indicate areas where we are closer to the
iteration limit (100). As one might expect, these areas outline the
stable regions. Farther away from the center, very few iterations are
needed to break the threshold (which makes sense since our starting value
of C (and hence Z after the first iteration) is higher).