Project Introduction
Unrelated to my research activities are these
Python maps of population data from the 2010
census. The code that generated these maps is
modified from this online tutorial on how
to
make a map of unemployment data.
Scripts
These are the links to my scripts that generated
these maps and the legends. Feel free to use or
modify these scripts for your own personal use.
Comments and acknowledgements are provided at
the top of each script. These files are already
in the .py format (can be opened in any
plain-text editor). Note: I am a beginner at
Python, so I'm not sure if me making these in a
Windows 7 environment will impact how they are
viewed on other systems.
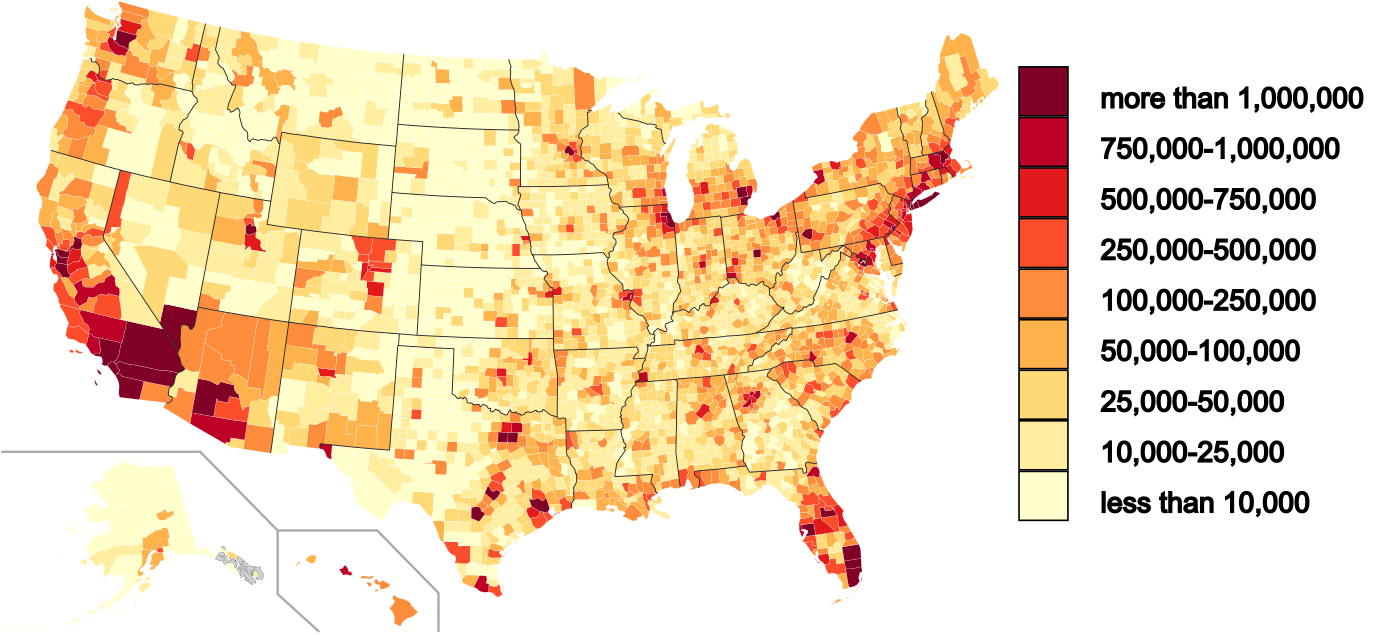
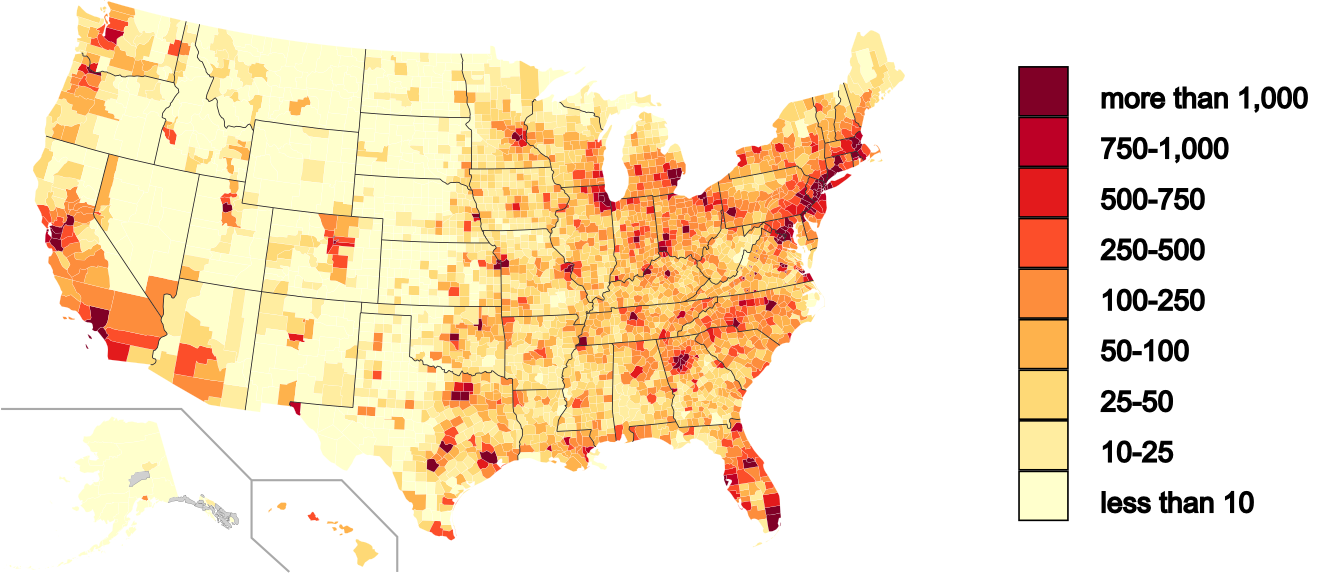
The Maps
2010 Population
2010 Population Density
SVG Maps
These links are the maps in Scalable Vector
Graphics (SVG) format. This allows the user to
zoom in and out using the zoom commands in their
internet browser.
Map Legends
|