<html>
<head>
<title>
MICHAEL R. JAMES - GEMPAK SCRIPTS
</title>
<link rel="stylesheet" href="../css_basic.css" type="text/css">

</head>
<body bgcolor=CFCAB6>

<span class="greenbeerhed">GEMPAK SCRIPTS</span>

<br>
<br>

<table class=beerfoot>
 <tr>
  <td width=200>

  <li><a href=Trenberth_1000-500.txt>Trenberth_1000-500.txt</a> </td><td>
  (<a href=http://weather.ou.edu/~mjames/wx/1000-500_Trenberth.png>image</a>)

  </td>
 </tr>
  <tr><td colspan=2><ul>
Plots 1000-500 mb thickness, 1000-500 mb Thermal Wind, and 700 mb absolute vorticity.  
Regions of 700 mb vorticity advection by the Thermal Wind indicate rising motion in the 
layer. (see <a href=TrenberthFormulation.html>this link</a> 
for the Trenberth Formulation)
  </ul></td></tr>
 <tr>
  <td>

  <li><a href=isenUS.txt>isenUS.txt</a> </td><td>
  (<a href=http://weather.ou.edu/~mjames/wx/isenUS300.png>image</a>)

  </td>
 </tr>
  <tr><td colspan=2><ul>
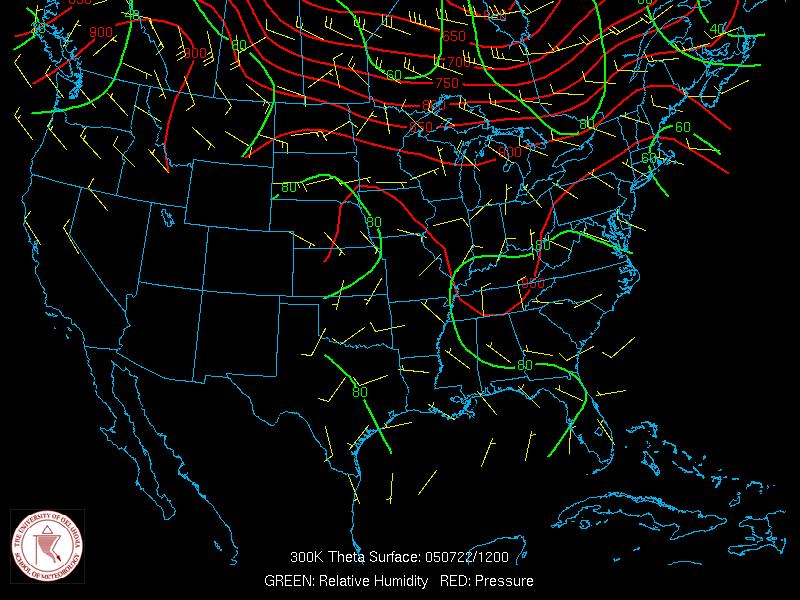
Plots winds along isentropic surfaces for the entire United States with contours of 
pressure and relative humidity.  Isentropic surfaces range from 285 K to 320 K in 5 K 
intervals.
  </ul></td></tr> 
<tr>
  <td>

  <li><a href=isentropic_mr.txt>isentropic_mr.txt</a> </td><td>
  (<a href=http://weather.ou.edu/~mjames/wx/isenMR300.png>image</a>)

  </td>
 </tr>
  <tr><td colspan=2><ul>
Plots winds along isentropic surfaces for the Southern Plains with contours of
pressure and mixing ratio.  Isentropic surfaces range from 285 K to 320 K in 5 K
intervals.
  
</ul></td></tr>
 <tr>
  <td>

  <li><a href=isentropic_rh.txt>isentropic_rh.txt</a> </td><td>
  (<a href=http://weather.ou.edu/~mjames/wx/isenRH300.png>image</a>)

  </td>
 </tr>
  <tr><td colspan=2><ul>
Plots winds along isentropic surfaces for the Southern Plains with contours of
pressure and relative humidity.  Isentropic surfaces range from 285 K to 320 K in 5 K
intervals.
  </ul></td></tr>
 <tr>
  <td>

  <li><a href=ounthta.txt>ounthta.txt</a> </td><td>
  (<a href=http://weather.ou.edu/~mjames/wx/ounthta.jpg>image</a>)

  </td>
 </tr>
  <tr><td colspan=2><ul>
Plots vertical profiles of potential temperature and equivalent potential temperature 
along with a vertical wind profile.
  </ul></td></tr>
 <tr>
  <td>

  <li><a href=500mbAnalysis.txt>500mbAnalysis.txt</a> </td><td>
  (<a href=http://weather.ou.edu/~mjames/wx/500mbAnalysis.png>image</a>)

  </td>
 </tr>


  <tr><td colspan=2><ul>
Plots 500 mb height, relative humidities greater than 70%, and RAOB upper air numbers.  
The white background of the GIF image is made transparent with <a 
href=http://www.imagemagick.org/>imagemagick</a> and then overlayed onto a blank, colored 
background image. (still has bugs)
  </ul></td></tr>
</table>

<br>
<span class="beerfoot">
<a 
href=http://my.unidata.ucar.edu/content/software/gempak/help_and_documentation/manual/index.html>GEMPAK 
User Guide</a>
</span>
<br>
<br>
<!-- <span class="greenbeerhed">GNUPLOT MESONET METEOGRAMS</span> -->

<br>
<br>
