|
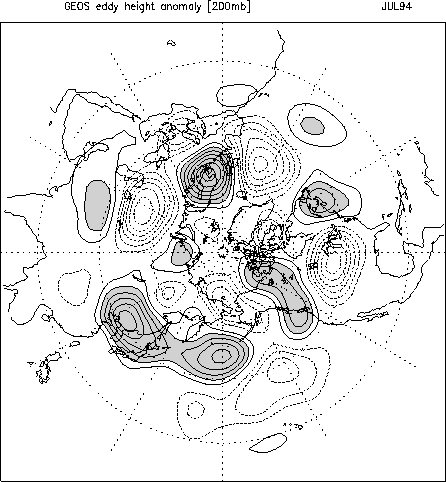
| Fig. 1. The 200 mb eddy height anomalies for July 1994. Contour interval is 20 m. The values greater than 40 m are shaded. The zero contours are not drawn. |
| Editor's Note: This paper was presented at the 2nd International Workshop on the East Asian Monsoon, 21-22 October 1996, Seoul, Korea. The author cordially allowed to republish it for the AMON by adding an abstract. |
ABSTRACT |
|
During the summer of 1994, East Asian countries (Korea, Japan and China) experienced record-breaking heat and drought conditions. The absence of the summer monsoon rainfall resulted in a severe water shortage in agriculture and industry over the highly populated regions of Korea, Japan, and central China throughout the year. This study documents the unusual evolution of the East Asian circulation during the summer of 1994 using the NASA/Goddard Earth Observing System (GEOS-1) assimilated data. The results show that the abnormal evolution of the seasonal cycle, which is associated with the early development of the upper level anticyclonic flow over East Asia, is responsible for the absence of the middle latitude monsoon rainfall (Changma in Korea and Baiu in Japan) during July. This study suggests useful long-range predictions of the middle latitude monsoon rest on our ability to predict the occurrence of the Eurasian waves and their interaction with orography. |
The Asian summer monsoon has a profound social and economic impact in East Asia and its surrounding countries. While the monsoon evolution is largely phase-locked with the seasonal cycle, the recent devastating drought over the East Asian countries in the summer of 1994, in particular, highlights the range of variability in the progress of the monsoon. During the summer of 1994, East Asian countries (Korea, Japan and China) experienced record-breaking heat and drought conditions. The absence of the summer monsoon rainfall resulted in a severe water shortage in agriculture and industry over the highly populated regions of Korea, Japan, and central China throughout the year. The forcing mechanisms responsible for such an extreme failure of the monsoon are yet to be understood.
Analyses produced at the operational weather forecast centers have been an
important tool for climate research. One of the most difficult problems often
encountered in using the operational analysis data, however, is the spurious
variations in the analysis data introduced by frequent changes and improvement
of the numerical weather prediction systems. Reanalysis with nonvarying
analysis/forecast system, for this reason, has become an important subject with
the hope that it will resolve the problems with the operational analyses. The
Data Assimilation Office (DAO) in the Goddard Laboratory for Atmospheres has
recently produced a multi-year global assimilated data set employing a fixed
data assimilation system. The GEOS-1 (Goddard Earth Observing System Version-1)
assimilated data are used to document the large-scale circulation associated
with the drought, and to understand the physical mechanisms responsible for the
drought. This study will address the following questions concerning the East
Asian drought: (1) What are the roles of tropical and middle latitude sea
surface temperature (SST) anomalies? (2) What is the importance of the Tibetan
Plateau? (3) To what extent are the East Asian anomalies connected with the
hemispheric scale circulation anomalies?
The main components of the GEOS data assimilation system are an atmospheric
general circulation model (GCM) (Takacs et al. 1994; Suarez and Takacs 1995)
and a 3-dimensional, multivariate optimal interpolation (OI) scheme (Pfaendtner
et al. 1995). The OI analysis scheme is carried out at a horizontal resolution
of 2 degree latitude by 2.5 degree longitude at 14 upper-air pressure levels
and at sea level. The upper-air analyses of height, wind and moisture
incorporate the data from rawinsondes, dropwindsondes, rocketsondes, aircraft
winds, cloud tracked winds, and thickness from the historical TIROS-N
(Television Infrared Observation Satellite) Operational Vertical Sounder (TOVS)
soundings produced by National Oceanic and Atmospheric Adminstration (NOAA)
National Environmental Satellite, Data and Information Service (NESDIS). The
GEOS GCM uses the potential enstrophy and energy-conserving horizontal
differencing scheme on a C-grid. The infrared and solar radiation
parameterizations follow closely those described by Harshvardhan et al. (1987).
The penetrative convection originating in the boundary layer is parameterized
using the Relaxed Arakawa-Schubert (RAS) scheme (Moorthi and Suarez, 1992).
Figure 1 shows the 200 mb eddy height anomalies for July 1994. The stationary
wave pattern is characterized by positive anomalies over East Asia, central
North Pacific, western North America, northeastern Canada, and Scandinavia.
This persistent anomaly pattern was blamed for the record-breaking summer heat
waves particularly over East Asia and northern Europe. In June of 1994, the
stationary wave pattern was not much different from the climatology over East
Asia. In July, however, the strong ridge pattern over East Asia resembles the
August climatology suggesting that the seasonal cycle over East Asia jumped
from June to August, and skipped July which is the most crucial period for the
rainfall over East Asia.

|
| Fig. 1. The 200 mb eddy height anomalies for July 1994. Contour interval is 20 m. The values greater than 40 m are shaded. The zero contours are not drawn. |
In this section we examine the entire nine year record available from the GEOS-1 assimilation to determine how the 1994 East Asian summer anomalies compare with previous years. The underlying hypothesis is that the 1994 anomalies are an extreme example of fluctuations in the seasonal cycle that occur on a more frequent basis. We focus on the zonal wind fluctuations and use an Empirical Orthogonal Function (EOF) analysis to provide an index of the circulation variability. Figure 2a shows the dominant EOF of the July and August zonal wind averaged for the sector 90°E-120°W longitude for the years 1985-93. This mode accounts for 45% of the variance.
Figure 2b shows the evolution of the first zonal wind EOF during July and
August for 1985-93. The July value for 1994 is the projection of the 1994 wind
anomaly onto the EOF computed from the previous nine years. The variation
occurs at low frequency with positive values occurring prior to 1986, between
1988 and 1991, and again in 1994. Figure 2c shows the variation of the central
North Pacific SST anomalies over the same time period. The correspondence with
the zonal wind variation is quite remarkable, suggesting a strong link between
zonal wind changes and SSTs.

|
| Fig. 2. (a) The first EOF pattern of u-wind averaged in the East Asian/Pacific sector (90°E-150°W), (b) its corresponding coefficients, and (c) SST anomalies over the central North Pacific. Units are in degree in (c). |

|
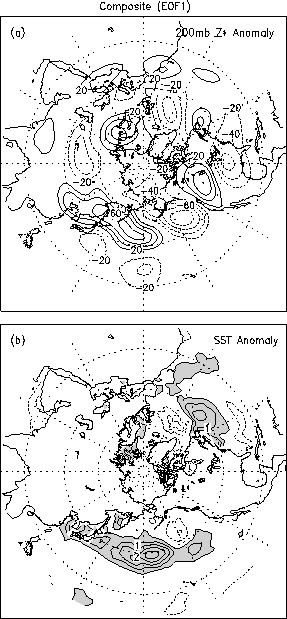
| Fig. 3. (a) The 200 mb height and (b) SST anomalies for the composite difference, represented as high minus low, based on the coefficients in Fig. 2(b). Contour interval is 20 meter in (a) and 0.5°C in (b). The zero contours are not drawn. Shading represents positive anomalies greater than 0.5°C in (b). Dotted lines represent the negative values. |

|
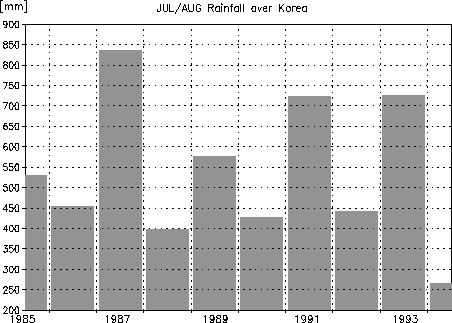
| Fig. 4. Accumulated precipitation for July and August over Korea. Units are in mm. |
While the above results suggest an SST connection to the zonal mean circulation
anomalies in the middle latitudes, the forcing mechanism actually responsible
for the development of the East Asian anticyclonic anomalies is not clear. As
discussed by Frankignoul (1985) in his comprehensive review of air-sea feedback
processes in the midlatitudes, numerous observational and modeling studies
suggest that middle latiutude SST anomalies are ineffective at generating
circulation anomalies. To examine this possibility we show in Figure 5 the
time-lagged correlations between the weekly SST anomalies over the central
North Pacific and 500 mb height anomalies for the warm season. The results
show that the atmospheric anomalies are leading the SST anomalies by about 2
weeks. Thus it appears unlikely that the SST anomalies are initiating the
atmospheric anomalies, though we have not ruled out the possibility that the
SST anomalies, once established, are feeding back on the circulation.

|
| Fig. 5. Lag correlation between the SST and 500 mb height anomalies during the warm season (May-September) over the central North Pacific (35°N- 45°N, 150°E-150°W). The abscissa represents the lag between the two time series in weeks; positive when height leads SST. |

|
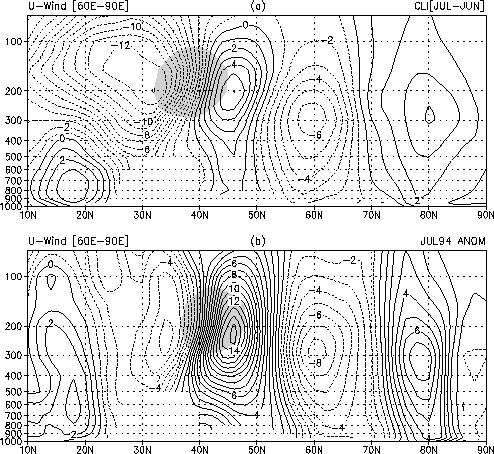
| Fig. 6. The latitude-pressure sections of the u-wind for (a) the climatology difference (July-June) and (b) July 1994 anomaly. The values are averaged over the western mountain terrain (60°E-90°E). Contour interval is 1 meter. |
The multiyear global atmospheric data using a nonvarying assimilation system
provide valuable information for understanding the nature of climate variation
by removing the spuriouds variability due to algorithm changes. This study
documents and analyzes the unusual evolution of the East Asian circulation
during the summer of 1994 using the GEOS-1 assimilated data. The results show
that the abnormal evolution of the seasonal cycle, which is associated with the
early development of the upper level anticyclonic flow over East Asia, is
responsible for the absence of the middle latitude monsoon rainfall (Changma in
Korea and Baiu in Japan) during July. It is suggested that the enhancement of
the typical late June and July orographic forcing is the primary cause of the
premature development of the 1994 East Asian anticyclone which, by
circumventing the normal July rainy season, lead to the East Asian drought. In
the present case the orographic forcing is believed to be the result of the
interaction with the anomalous Eurasian wave train extending into central
Asia. This study suggests useful long-range predictions of the middle latitude
monsoon rest on our ability to predict the occurrence of the Eurasian waves and
their interaction with orography.
Frankignoul, C., 1985: Sea surface temperature anomalies, planetary waves, and air-sea feedback in the middle latitudes. Rev. Geophys., 23, 357-390.
Harshvardhan, R. Davies, D.A. Randall, and T.G. Corsetti, 1987: A fast radiation parameterization for atmospheric circulation models. J. Geophys. Res., 92, 1009-1016.
Helfand, H.M. and J.C. Labraga, 1988: Design of a non-singular level 2.5 second-order closure model for the prediction of atmospheric turbulence. J. Atmos. Sci., 45, 113-132.
Moorthi, S. and M. J. Suarez, 1992: Relaxed Arakawa-Schubert: A parameterization of moist convection for general circulation models. Mon. Wea. Rev., 120, 978-1002.
Pfaendtner, J., S. Bloom, D. Lamich, M. Seablom, M. Sienkiewicz, J. Stobie and A. da Silva, 1995: Documentation of the Goddard Earth Observing System (GEOS) Data Assimilation System-Version 1. NASA Tech. Memo. No. 104606, volume 4, Goddard Space Flight Center, Greenbelt, MD 20771, pp 44, Jan 1995.
Suarez, M. J. and L. L. Takacs, 1995: Documentation of the Aries/GEOS Dynamical Core Version 2. NASA Tech. Memo. No. 104606, volume 5, Goddard Space Flight Center, Greenbelt, MD 20771.
Takacs, L.L., A. Molod, and T. Wang, 1994: Goddard Earth Observing System (GEOS) general circulation model Version 1. NASA Tech. Memo. No. 104606, volume 1, Goddard Space Flight Center, Greenbelt, MD 20771.