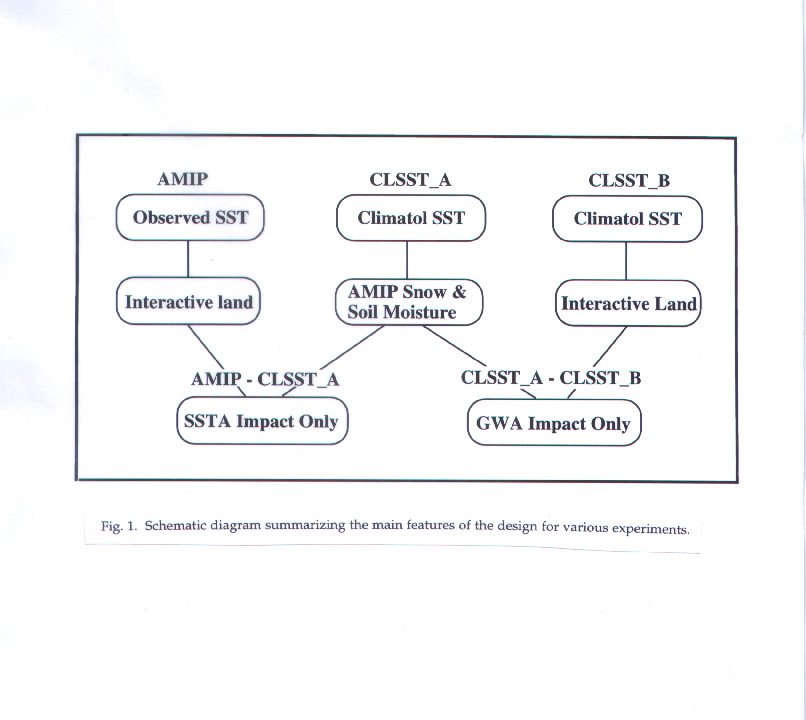
 | Fig. 1. Schematic diagram summarizing the main features of the design for various experiments. |
|
We have carried out a series of experiments with a general circulation model to understand the influences of sea surface temperature (SST) and ground wetness (GW; measured by snow amount and soil moisture content) on the Asian summer monsoon. The experiments are designed to illustrate the dominant monsoon response to SST and GW forcings and to delineate the relative importance of each
forcing function in contributing to the variability of the monsoon.
Results indicate that ocean basin-scale SST anomalies exert a stronger control on the interannual variability of Asian summer monsoon compared to GW anomalies. The impact of SST anomalies on the monsoon is nonlinear with respect to warm and cold events. The monsoon is weakened during the warm events but changes less noticeably during the cold events. Associated with the warm SST anomalies, both the Walker circulation and local Hadley circulation diminish substantially. These changes are accompanied by reduction in total rainfall and water vapor convergence in the Asian monsoon region. It is also found that, following a wet land surface condition (enhanced snow and soil moisture) in the Asian continent, the Asian summer monsoon becomes moderately weaker. Antecedent land surface processes mainly influence the early part of summer monsoon. Wetter and colder conditions in the Asian continent can be caused by warm SST anomalies. This suggests that land surface processes interact with oceanic processes to reinforce weak monsoon anomalies produced initially by warm SST forcing. These interactive forcings are also responsible for the variability of the winter-spring westerlies over subtropical Asia, which is a key precursory signal for the evolution of the subsequent Asian summer monsoon.
|
The influence of land surface processes on the Asian summer monsoon has also been studied extensively (Yeh et al. 1984; Barnett et al. 1989; Yasunari et al. 1991; Meehl 1994a; Vernekar et al. 1995; Zwiers 1993; Douville and Royer 1996; Li and Yanai 1996; and Lau and Bua 1997). Most GCM studies focus on the relationship between the monsoon and the Eurasian snow amount of the previous cold seasons. It has been suggested that more (less) wintertime snow amount is generally followed by a weaker (stronger) Asian summer monsoon. In most of these experiments, models are forced by prescribed snow mass. Hydrologic and radiative processes are usually involved in explaining the snow-monsoon relationship that is simulated.
Despite our recognition of the influences of SST and land surface processes, the relative contribution of each forcing function to the variability of Asian monsoon has not been assessed. Unlike SST, forcing functions associated with land surface processes are very complex, involving the interaction among ground temperature, soil moisture, and all components of surface energy budgets. In GCM experiments, results may differ depending on what land surface parameters are specified. Furthermore, in the real system, SST and land surface process themselves are likely to be mutually interactive (Meehl 1994b, 1997; Yang 1996). This interactive nature gives rise to an additional difficulty in understanding the physical processes that are responsible for the variability of the monsoon.
Another important issue that is related to SST and/or land surface forcing is the cause for precursory signals for the Asian summer monsoon. For seasonal-to- interannual predictions of the broad-scale Asian monsoon, useful precursory signals have been found in the variability of subtropical upper-level westerlies during the previous winter and spring seasons. The observational study by Webster and Yang (1992) shows that prior to anomalously strong (weak) Asian summer monsoon circulation, the 200 mb westerlies over subtropical Asia are weaker (stronger) than normal. These signals are potentially important for predicting monsoon climate because they occur over a broad region and last persistently for several seasons. Similar features of the precursory signals emerge also from atmospheric GCM simulations (Ju and Slingo 1995; Yang et al. 1996).
Clearly, atmospheric processes themselves are unable to provide such a long- term memory, so the signals must have their roots in the slowly-varying boundary forcing at the Earth's surface. Previous studies have attributed the signals to the remote influence from tropical SST and the more local impact of Asian land surface processes such as variations in snow mass and soil moisture content. However, the physical processes of the association between monsoon's precursory signals and the dominant forcing functions have not been demonstrated.
In this study, we aim at providing a better understanding of the mechanisms for the interannual variability and precursory signals associated with the Asian summer monsoon. We will depict the dominant features associated with the influences of SST and land surface forcings on the monsoon and its precursory signals. The relative importance of the forcings and the underlying physical processes will be stressed. To accomplish our goal, we conduct a series of experiments using the NASA Goddard Laboratory for Atmospheres (GLA) GCM. Emphasis will be put onto an understanding of the relative importance of SST and ground wetness (GW) variations in the variability, mainly on seasonal-to- interannual time scales, of the broad-scale Asian summer monsoon. For land surface hydrologic processes, we focus on the forcing functions provided by the changes in snow mass and soil moisture content.
The organization of this paper is as follows. In section 2, we describe briefly the main features of the model, experiment design, and observational data sets used for validating model results. Presented in section 3 is a comparison between model and observations for the seasonal mean climate, annual cycle, and interannual variability of the Asian monsoon. Influences of SST and GW variations on the mean monsoon climate are shown in section 4. The interannual variability of monsoon induced by SST and land surface anomalies is discussed, respectively, in sections 5 and 6. A summary and a discussion of the results are given in section 7.
For this work, three experiments have been carried out for the climate decade of 1979-1988. In the first experiment (AMIP), the model is forced by globally observed monthly SST, with fully interactive model atmosphere and land surface processes. This experiment was performed for AMIP and detailed features of the Asian monsoon simulated by this experiment have been already reported in Lau and Yang (1996) and Yang et. al (1996). In the second experiment (CLSST_A), the model is forced by the climatological annual cycle of the observed AMIP SST. In this experiment, snow mass and soil moisture content are prescribed to the daily values produced by AMIP, i.e., the snow amount and soil moisture content of CLSST_A are identical to those of AMIP. Thus, the differences in atmospheric response between the two experiments are due to the impact of SST anomalies alone. The SST forcing used in the third experiment (CLSST_B) is identical to that used in CLSST_A. The only difference between these two experiments is that the model atmosphere and land surface are fully interactive in CLSST_B. This atmosphere-land interaction should produce different snow and soil moisture from those used in CLSST_A. Thus, the differences in atmospheric response between CLSST_A and CLSST_B result from the sole effect of different treatments of land surface processes. The above description of the various experiments is summarized in the schematic diagram shown in Fig. 1.
| Fig. 1. Schematic diagram summarizing the main features of the design for various experiments. |
To provide a sense of the relative magnitude of the surface forcing functions, we show in Fig. 2 the time series of monthly Niño-3 SST used in AMIP and CLSST_A as well as those of soil moisture content averaged for 30°N-50°N, 30°E- 130°E used in CLSST_A and CLSST_B. It can be seen from Fig. 2a that two major warm events (1982-1983 and 1986-1987) and two strong cold events (1984-1985 and 1988) occur during the AMIP decade. The impact of SST anomalies of these events on the Asian monsoon will be discussed subsequently. Figure 2b shows that soil moisture content changes clearly from year to year in both CLSST_A and CLSST_B. Although the largest differences between the two experiments usually appear during summer and fall seasons due to the effect of monsoon rainfall, the different values before the Asian summer monsoon season will be the focus of this study.
 | Fig. 2. (a) Niño-3 SST (�K) index used in AMIP and CLSST_A. (b) Monthly values of area (20°N-50°N, 30°E-130°E) averaged soil moisture content (cm) used in CLSST_A and CLSST_B. |
A number of observational data sets are used in this study to validate results from the control experiment (AMIP). They include the 200 mb and 850 mb winds of the Climate Diagnostics Data Base (CDDB) analyses from the National Centers for Environmental Prediction (NCEP), Microwave Sounding Unit (MSU) rainfall estimate over oceans (Spencer 1993), and analyses of station rainfall over land areas. For rainfall validation, we used the global rainfall data set obtained by combining the MSU ocean estimate and land-station rainfall (Schemm et al. 1992). For convenience, the global rainfall will still be referred to as MSU rainfall in this study. All of these data sets contain monthly mean values and cover the AMIP decade.
 | Fig. 3. 10-year (1979-1988) climatology of 200 mb winds (ms-1) from NCEP CDDB analyses and AMIP experiment. Averaged patterns are shown, respectively, for December-February (DJF) and May-September (MJJAS). |
Discrepancies between the observed and simulated atmospheric circulation are also noticeable. For example, the model generally overestimates the intensity of upper tropospheric flow, especially over the Southern Hemisphere during MJJAS. This problem has been reported by Lau and Yang (1996) who have conducted a more thorough examination of the model's simulation of Asian summer monsoon on a variety of time scales.
Figure 4 shows the comparison between MSU and simulated rainfall for DJF and the extended summer season MJJAS. The model rainfall patterns are similar to the observed in many ways. This is particularly true for DJF (Figs. 4a-b) when many rainfall phenomena including the Asian-Australian winter monsoon, the storm tracks, the southern Pacific convergence zone, and the intertropical convergence zone over Africa and the Indian Ocean are simulated quite realistically. For MJJAS (Figs. 4c-d), the model captures the main, large-scale features of monsoon rainfall such as the maximum centers over tropical Asia, Africa, and the western Pacific. However, compared to the observation, the simulated rainfall does not extend sufficiently northward to the Bay of Bengal. As indicated by Lau and Yang (1996), the model underestimates the Mei-yu rain belt in East Asia. It should be pointed out that the MSU generally shows more rainfall in the subtropical oceanic storm track regions and equatorial central-eastern Pacific compared to other satellite estimates, as shown by Lau et al. (1996).
 | Fig. 4. 10-year (1979-1988) climatology of rainfall (mm/day) from MSU estimate and AMIP experiment. Averaged patterns are shown, respectively, for December-February (DJF) and May-September (MJJAS). |
Figure 5 shows the latitude-time cross-sections of the 10-year mean annual cycle of Asian monsoon rainfall. The rainfall is averaged between 50°E and 120°E and shown for MSU and AMIP, respectively. The figure indicates a similarity in the phase of monsoon transition between the observed and simulated rainfall. In both panels, monsoon rainfall attains a maximum magnitude in June and reaches its northernmost position during July-August. Similar to the observed, the model monsoon exhibits a sudden northward jump during a period from late boreal spring to early summer, although it tends to be confined to lower latitudes (10°N-15°N) compared to the observed (15°N-20°N). The abrupt monsoon transition described above is one of the most prominent features associated with the onset of the Asian summer monsoon system (Lau and Li 1984). An updated, detailed description of this feature for the Southeast Asian monsoon is recently given by Lau and Yang (1997).
 | Fig. 5. Latitude-time sections of monthly rainfall climatology averaged within 50°E-120°E for MSU (a) and AMIP (b). |
To illustrate the interannual variability of model rainfall, we show in Fig. 6 the observed and simulated monthly rainfall in time-longitude cross-sections averaged for the latitude band of 2°S-10°N. It can be seen that the major features of MSU rainfall have been captured quite well by the model. For example, the model rainfall exhibits a pronounced interannual variability which is comparable to that in MSU observation. Both panels show that the maximum tropical rainfall is mostly confined to the longitudes of 140°E-170°E. This rainfall maximum is separated from another secondary rainfall maximum over the Indian Ocean by a relatively narrow and dry zone between 120°E and 140°E. During the El Niño years of 1982-1983 and 1986-1987, the maximum rainfall over the western Pacific diminishes and shifts to the central-eastern Pacific. However, the longitudinal shift of model rainfall seems less pronounced than that indicated by the MSU estimate.
 | Fig. 6. Longitude-time sections of monthly rainfall averaged within 2°S-10°N for MSU and AMIP. |
The weakening of Asian summer monsoon circulation due to the SST anomalies used in AMIP is consistent with the changes in monsoon rainfall over tropical Asia and the surrounding oceans. Figure 7b shows that monsoon rainfall is reduced over a broad region with strongest signals over tropical Asia, the Bay of Bengal, and New Guinea. These regions are in agreement with the locations of anomalous confluence of the upper-tropospheric monsoon circulation shown in Fig. 7a. Other changes in rainfall associated with the SST anomalies include the rainfall increase over the central Pacific and east of the Philippines. However, no significant signal can be found over Africa, tropical southern Indian Ocean, and subtropical-extratropical regions.
 | Fig. 7. Differences in MJJAS climatologies of 200 mb winds (a) and rainfall (b) between AMIP and CLSST_A. |
To depict the impact of SST variations on the seasonal cycle of Asian monsoon, we show in Fig. 8 the latitude-time section of the mean rainfall difference between AMIP and CLSST_A averaged for 50°E-120°E. It is clearly shown that, in the core monsoon latitudes (e.g., 5°N-25°N), the AMIP rainfall is reduced substantially during May-October (with the exception of June). That is, the AMIP SST anomalies reduce monsoon rainfall not only during the peak-monsoon months but also during monsoon's onset and retreat periods. The figure indicates a substantial rainfall reduction in May. It also shows a weaker seasonal cycle of the Asian monsoon in AMIP than in CLSST_A. In equatorial regions and the Southern Hemisphere tropics, AMIP rainfall also diminishes but mainly from December to May.
 | Fig. 8. Latitude-time section of the difference in monthly rainfall climatology (50°E-120°E) between AMIP and CLSST_A. |
The influence of ground wetness anomalies on the mean monsoon climate can be seen from Fig. 9 which shows the mean wind and rainfall differences between CLSST_A and CLSST_B. The figure indicates that, like the SST forcing, the anomalies of snow amount and soil moisture content generally reduce the intensity of the Asian summer monsoon. This can be seen in the weaker upper-tropospheric easterlies and reduced rainfall over tropical Asia. However, the signals have a smaller magnitude than those accounted for by the SST anomalies shown in Fig. 7. Several differences can be observed between Fig. 7 and Fig. 9. First, associated with the GW anomalies is an increase of westerly component over a relatively narrow latitude band centered near 20°N. This change includes the decrease of upper-level monsoon easterlies over tropical Asian land regions but not over the Indian Ocean and equatorial regions. Secondly, the reduction in monsoon rainfall associated with the GW anomalies appears mainly over Southeast Asia, the South China Sea, and east of the Philippines but not over India and its surrounding regions. Figure 9b indicates a weak dipole pattern between the South China Sea and the land area to the north-northwest. Lau and Bua (1997) found a similar precipitation dipole and attributed its presence to local land-atmosphere interactions. Overall, the GW anomalies lead to a much less well-defined spatial pattern of the changes in Asian summer monsoon and have a small impact on equatorial regions especially over oceans.
 | Fig. 9. Same as Fig. 7 but for the differences between CLSST_A and CLSST_B. |
Figure 10 depicts the impact of GW anomalies on the seasonal cycle of Asian monsoon rainfall. Monsoon rainfall is reduced clearly in May and June but not during the late monsoon period. Indeed, the signal is quite mixed in July and rainfall increases slightly in August and September. This is consistent with the results of Slingo (1996; personal communication) and Dong and Valdes (1997) who also found that land surface processes mainly influence the early part of the Asian summer monsoon. The feature discussed here is certainly different from that shown in Fig. 8 where SST anomalies exert an influence on a large portion of the annual cycle of monsoon. In addition, Fig. 10 indicates that the GW anomalies enhance the winter rainfall in the tropical regions of both hemispheres. This implies that GW anomalies may have an influence on the Asian-Australian winter monsoon.
 | Fig. 10. Same as Fig. 8 but for the difference between CLSST_A and CLSST_B. |
a. Warm and cold SST events
We define warm and cold SST events using the index of SST in the El Niño-3 region (5°S-5°N, 150°W-90°W; see Fig. 2). Based on the MJJAS averaged values of the index, 1983 and 1987 have been chosen for the warm events, and 1984 and 1988 for the cold events. The composite patterns of SST anomalies for these warm and cold events are shown in Fig. 11. Except for the coastal waters and southeastern Indian Ocean, the sign of SST anomalies is nearly opposite between the two patterns. The most noticeable signal appears in the central-eastern Pacific Ocean where the SST anomalies in warm and cold events are of similar magnitude but opposite sign.
 | Fig. 11. Composite patterns of MJJAS SST anomalies (°C) for warm (1983 and 1987; a) and cold (1985 and 1988; b) events. |
The response of Asian summer monsoon to the SST anomalies during the warm and cold events chosen is depicted in Fig. 12, which shows the differences in 200 mb winds and rainfall between AMIP and CLSST_A. Associated with the warm SST anomalies, the monsoon becomes significantly weaker. Figure 12a indicates that, over a broad region including tropical Asia, the Indian Ocean, and part of western Pacific, the easterly monsoon flow in AMIP is much weaker than that in CLSST_A. Consistently, monsoon rainfall diminishes substantially in these regions. In the equatorial central-eastern Pacific, the warm SST anomalies increase the local rainfall rate. The upper westerlies are weakened and anticyclonic and cyclonic circulation patterns appear in the Northern and Southern Hemispheres, respectively. These features are similar to those observed during El Niño years (e.g., Rasmusson and Carpenter 1982; Yang and Webster 1990; and Wang 1992).
In contrast, only a mixed signal can be found in the response of Asian monsoon to cold-event SST anomalies. Figure 12b shows that the monsoon circulation intensifies over the western Pacific Ocean and the South China Sea but diminishes in the regions to their west. Indeed, the cyclonic pattern over tropical Asia and the Indian Ocean indicates a slight weakening rather than strengthening of the monsoon. The response of monsoon rainfall to the cold SST anomalies does not exhibit an organized pattern compared to the warm SST anomalies. Although rainfall increases over the tropical Arabian Sea, Bay of Bengal, South China Sea and Indonesia, a reversal change can be seen to the north of the enhanced-rainfall band. Over the central-eastern Pacific, the upper westerlies become stronger over equatorial regions but weaker over the subtropics. Although this feature is similar to that observed during La Niña years, it is far from a mirror image of the feature shown in Fig. 12a because of the differences in both magnitude and phase. Therefore, the response of atmospheric circulation, especially the Asian monsoon, to the warm and cold SST anomalies is largely nonlinear.
 | Fig. 12. Composite patterns of the differences in MJJAS 200 mb winds (vectors) and rainfall (contour interval: 1 mm/day) between AMIP and CLSST_A for warm (a) and cold (b) events. Negative values are shaded for rainfall difference. |
The nonlinear response of Asian monsoon to SST anomalies shown in Fig. 12 is consistent with the result of Soman and Slingo (1997) who study the response of monsoon to SST using the Universities' Global Atmospheric Modelling Programme GCM. In general, the equatorial Pacific SST anomalies are not linear functions of the Southern Oscillation (Philander 1990). Even in the case of precisely equal and opposite phases of tropical SST forcing, the response of atmospheric circulation is still nonlinear (Hoering et al. 1997). A nonlinear response of rainfall occurs clearly even over the central-eastern Pacific where SST anomalies are nearly opposite. The result shown in Fig. 12 is supported by the observational study of Yang (1996) who shows that the Indian monsoon responds more significantly to El Niño events than to La Niña events. Because of the smaller impact of cold SST anomalies, we will focus only on the influence of warm SST forcing in the following discussion.
During the warm events, the AMIP sea level pressure decreases over the central-eastern Pacific and increases over tropical Asian regions, leading to a reduction in the zonal gradient of atmospheric pressure (not shown). Consistently, the trade winds over the entire tropical Pacific basin are weaker in AMIP than in CLSST_A. Figure 13 presents the differences in atmospheric circulation, between AMIP and CLSST_A, in the longitude-height cross-sections along 2°N-14°N and latitude-height sections along 50°E-120°E. It shows clearly the changes in the lateral and transverse monsoons as well as the relation of these monsoon components to the Walker circulation over the Pacific Ocean. Associated with the warm SST anomalies is the weakening of both the Walker circulation and transverse monsoon in AMIP (Fig. 13c). This attributes to a reduction in convective activity and thus upward motion over the Asian monsoon region. At the same time, the local Hadley cell (lateral monsoon) becomes significantly weaker, as seen from the anomalous downward motion between 5°N and 25°N and upward motion over the tropical latitudes of the Southern Hemisphere (Fig. 13d). These features are similar to those simulated by other atmospheric models (Keshavamurty 1982; Kitoh 1992).
 | Fig. 13. Longitude-height section (along 2°N-14°N; a) and latitude-height section (along 50°E-120°E; b) of the MJJAS circulation from AMIP for warm SST events (1983 and 1987). Shown in (c) and (d) are the differences in these vertical cells between AMIP and CLSST_A. |
Here, we explain the influence of the warming of central-eastern Pacific on the Asian monsoon by the SST-related changes in the Walker and Hadley vertical cells. In the discussion of the inter-related changes in SST, the vertical cells and the Asian monsoon, we focus on a simultaneous relationship or a "fast" forcing- response aspect occurring during MJJAS only. For this reason, we refer to this influence of SST on the Asian monsoon as SST's direct impact. The indirect impact of SST on the monsoon will be discussed in section 6b.
b. Regional water vapor budget
Because water vapor provides the fuel for latent heat release in monsoon convection, it is also important to understand the water vapor budget associated with changes of the aforementioned monsoon circulation features. We have calculated the water vapor budget for three monsoon subregions: the Indian subcontinent (I), Southeast Asia (II), and East Asian continent (III). Figure 14a shows the vertically-integrated (surface-to-200 mb) water vapor flux across the various boundaries and area-net water vapor budget for the AMIP experiment. It can be seen that during MJJAS there is a net water vapor convergence for all three regions, especially in Southeast Asia. This suggests that in these regions the rainfall rate is usually larger than the surface evaporation rate. For the Indian monsoon (region I), water vapor is transported into the region from all directions except the east. Although most of the in-coming water vapor is contributed by the transport from the western boundary, the area net gain (14.8x10⁷ Kgs-1) is accounted for by the net meridional flux (30.2x10⁷ Kgs-1), while the net zonal transport (-15.4x10⁷ Kgs-1) is out of the region. In contrast, the Southeast and East Asian domains obtain water vapor from southern and western boundaries and export it in their northern and eastern boundaries. Both zonal and meridional transports contribute to the water vapor convergence in the two regions, although the gain is small in the East Asian domain.
Figure 14b illustrates the difference in water vapor transport between AMIP and CLSST_A for the warm events, portraying the impact of warm SST anomalies on the water vapor budget in the Asian monsoon regions. The arrows indicate the relative directions with respect to those shown in Fig. 14a. For a specific boundary, if the arrows are in opposite direction in the two panels, the magnitude of water vapor flux of AMIP is smaller than that of CLSST_A. Otherwise, AMIP flux is larger. It can be seen that, associated with the warm SST anomalies, less water vapor is transported through all the boundaries except the East Asia domain. The largest reduction occurs in the western and eastern boundaries of the Indian domain. The weaker AMIP water vapor fluxes lead to smaller area water vapor convergence. The net gain is reduced by about 38% in the Indian monsoon region and 22% in Southeast Asia. It is found that the changes in surface evaporation rate from AMIP to CLSST_A are relatively small in the monsoon regions (not shown). Thus, the decrease in water vapor convergence accounts for most of the reduction in monsoon rainfall shown in Fig. 12a.
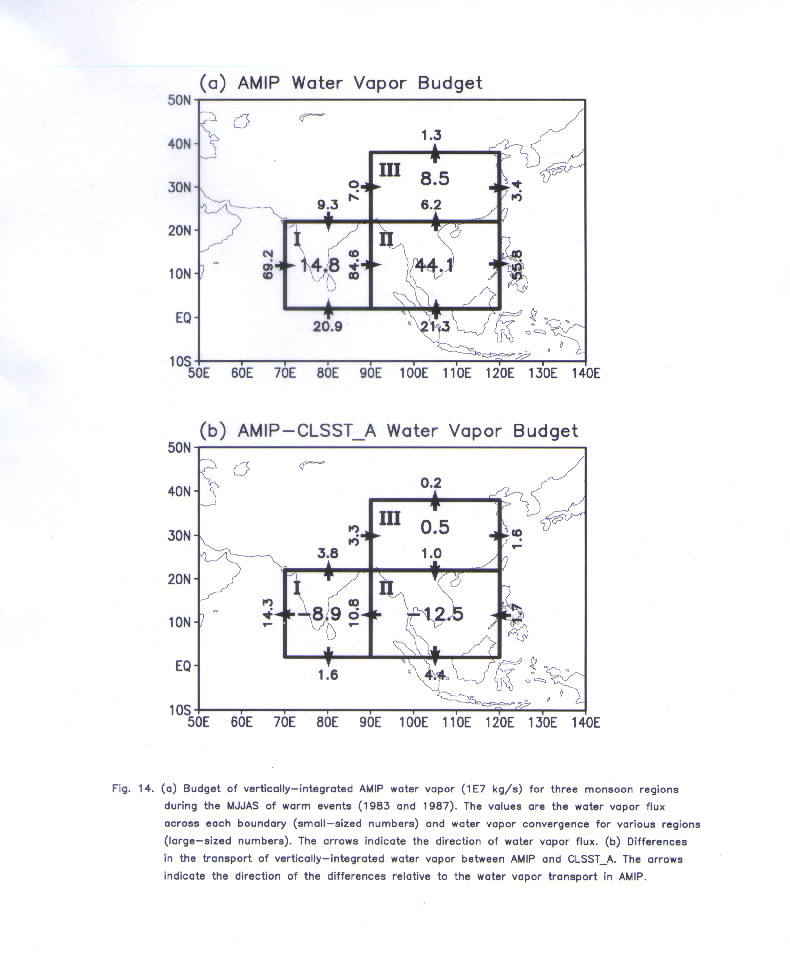 | Fig. 14. (a) Budget of vertically-integrated AMIP water vapor (107 kgs-1) for three monsoon regions during the MJJAS of warm events (1983 and 1987). The values are the water vapor flux across each boundary (small-sized numbers) and net water vapor budget for various regions (large-sized numbers). The arrows indicate the direction of water vapor flux. (b) Differences in the transport of vertically-integrated water vapor between AMIP and CLSST_A. The arrows indicate the direction of the differences relative to the water vaportransport in AMIP. |
c. Precursory signals
As stated in the introduction, strong precursory signals of the Asian summer monsoon exist in the subtropical westerly circulation and they may be linked to tropical SST forcing. In this study, we not only show the reproduction of the signals in our simulation but also demonstrate the role of SST forcing in the signals. Figure 15 shows the composite patterns of the difference in 200 mb winds between AMIP and CLSST_A for the warm SST events. The patterns are presented for summer monsoon season as well as the winter and spring seasons prior to the monsoon. The warm SST anomalies give rise to a weak Asian monsoon in JJA (June-July- August). Prior to the weak monsoon, strong westerlies appear over subtropical Asia during the previous cold seasons, especially in MAM (March-April-May). This is manifested by the intensification and equatorward shift of the Asian subtropical westerly jet stream. The feature shown in Fig. 15, especially that of the MAM pattern, is similar to the result of Yang et al. (1996; see their Fig. 7) in which the roles of SST and land surface processes have not been isolated. Since the changes shown in Fig. 15 have their root in SST only, it can be concluded that much of the antecedent signal is due to anomalous SST forcing. Whether or not land surface processes are responsible for the precursory signals of the monsoon will be discussed in section 6d.
 | Fig. 15. Composite patterns of the difference in DJF, MAM, and JJA 200 mb winds between AMIP and CLSST_A for warm events (1982-1983 and 1986-1987). |
In this section, we quantify the interannual variability of Asian summer monsoon as a response to the antecedent variations of cold-season snow amount and soil moisture content in the Asian continent. Our discussion will be based mainly on the analysis of results from experiments CLSST_A and CLSST_B.
a. SST-induced changes in GW
Previous studies have suggested that tropical SST anomalies may exert an impact on the wintertime land surface conditions in the Eurasian continent (e.g., Meehl 1994a; Yang 1996). In the following, we will test this conjecture by examining the changes in snow amount and soil moisture during warm and cold SST events. One should remember that even though climatological SST forcing is used in CLSST_A and CLSST_B, the anomalies of snow amount and soil moisture in CLSST_A are induced by SST variability because they are identical to those of AMIP.
Figure 16 shows the December-April (DJFMA) averaged patterns of the differences in snow mass and soil moisture content between CLSST_A and CLSST_B for two warm (1982-1983 and 1986-1987) and two cold (1980-1981 and 1984- 1985) events. It should be pointed out that we choose 1980-1981 instead of 1987-1988 as a cold SST winter because of the nearly normal SST in the latter (see Fig. 2). This is different from the classification shown in Fig. 11 where warm and cold events are determined by MJJAS SST. It can be seen from Fig. 16a that the warm SST anomalies produce more snow mass in subtropical Asia. In contrast, no organized pattern of snow change can be found associated with the cold SST anomalies (Fig. 16b). This suggests that the response of snow mass to SST forcing is nonlinear with respect to warm and cold SST events. Associated with the increasing snow amount produced by the warm SST anomalies, soil moisture content is enhanced (Fig. 16c). Thus, the warming of central-eastern Pacific is linked to a wet land surface shown in both snow and soil moisture fields. However, in spite of the mixed signal in snow mass pattern, soil moisture is reduced associated with the cold SST anomalies (Fig. 16d). This means that there is no clear relationship between the cold-SST related changes in snow and soil moisture fields. The relationship between snow mass and soil moisture may vary, depending on factors including conditions of the frozen land and the rate of snow melt. On the other hand, this problem could be caused by data sampling.
 | Fig. 16. Changes (differences between CLSST_A and CLSST_B) in DJFMA snow mass (kgm-2) and soil moisture content (cm) associated with wintertime warm (1982-1983 and 1986-1987) and cold (1980-1981 and 1984-1985) SST anomalies. |
b. Influence of GW on monsoon: SST's indirect impact
Figure 17 shows the changes in wintertime land surface processes which are accounted for by the snow and soil moisture forcings given in Fig. 16. With more snow amount and soil moisture over Asia, land surface albedo increases (Fig. 17a). Both hydrologic and albedo effects lead to a strong large-scale cooling in the Asian continent (Fig. 17b). As a result, sea level pressure increases significantly (Fig. 17c). Obviously, the decrease in surface temperature and increase in atmospheric pressure over the Asian continent enhance the winter-type thermal contrast and pressure gradient between land-mass and the neighboring oceans.
Figures 17d-f indicate that the anomalies of snow and soil moisture that are initially produced by cold SST anomalies do not cause well-defined changes in surface albedo, surface temperature, and sea level pressure. None of the response in these fields exhibits a pattern which is opposite to that shown in Figs. 17a-c. This is consistent with the mixed signal in snow forcing (Fig. 16c) but not the reduction in soil moisture content (Fig. 16d). A large-scale warming is missing from Fig. 17e in the presence of reduced soil moisture. This raises the potential importance of surface albedo besides a possible sampling problem. A careful examination of the figure indicates a consistent relationship among snow amount, surface albedo, and surface temperature in the model.
 | Fig. 17. Changes (differences between CLSST_A and CLSST_B) in DJFMA surface albedo, surface air temperature (°C), and sea level pressure (mb) that are produced by the snow and soil moisture forcing shown in Fig. 16. |
The notion that a pre-monsoon moistening and cooling of the Asian land- mass alone can lead to a weak monsoon circulation is demonstrated in Fig. 18. Figure 18a shows the difference in 200 mb winds between CLSST_A and CLSST_B for the MJJAS following the wet DJFMA as seen from Figs. 16a-b. It can be seen that the Asian summer monsoon is noticeably weaker in CLSST_A than in CLSST_B, with the strongest signal over the latitude band of 10°N-30°N. Clearly, the weakening of the monsoon is consistent with the decrease in surface temperature of the Asian continent (Fig. 17b). On the other hand, because of the small change in the DJFMA surface temperature during the 1980-1981 and 1984-1985 winters (Fig. 17e), the response of the Asian monsoon during the following summers is much weaker (not shown).
Figure 18 reveals another interesting feature: land surface processes only affect the early stage of the Asian summer monsoon. It can be seen that the feature depicted in Fig. 18a is largely accounted for by the change in monsoon circulation shown in Fig. 18b, a corresponding pattern of Fig. 18a but for May-June only. Indeed, both panels of the figure show a similar pattern including the reduction of monsoon easterlies over subtropical Asia. We also examine the corresponding pattern for July-September only (not shown) and find no noticeable and similar change in the monsoon circulation. This feature shown in monsoon circulation is supported by the change in latitude-time cross-section of monsoon rainfall shown in Fig. 10. Recently, Dong and Valdes (1997) show a similar result from simulations by the UGAMP GCM.
 | Fig. 18. Composite patterns (1983 and 1987) of the difference in 200 mb winds between CLSST_A and CLSST_B for MJJAS (a) and for May-June (b). The patterns are associated with the snow and soil moisture forcing shown in Figs. 16a-b. |
We have attributed the above-described weakening of monsoon to the enhanced snow amount and soil moisture in the Asian continent. Because of the design of our experiments, however, the changes in land surface hydrologic processes are rooted in the pre-monsoon warming of tropical central-eastern Pacific. Thus, we can consider that the winter-spring warming of the ocean exerts an influence on the monsoon through modulating land surface processes. To distinguish this from SST's direct impact discussed in section 5a, we refer to this influence as SST's indirect impact on the Asian summer monsoon.
c. Generally direct impact of GW
It has been shown above that the cold SST-related decrease in Asian soil moisture does not lead to a warming of land mass and thus intensification of the Asian summer monsoon. To avoid a possible bias due to sampling, we examine the relationship between soil moisture and monsoon in a different way. Figure 19 shows the year-to-year values of difference in DJFMA soil moisture content between CLSST_A and CLSST_B, averaged within the region of 20°N-50°N, 30°E-130°E. It can be seen that relatively large changes in soil moisture do not necessarily have one-to-one correspondence with warm or cold SST events. From the figure, we first classify 1982-1983, 1985-1986, and 1986-1987 into a more soil moisture group and 1979-1980, 1980-1981, 1983-1984, 1984-1985, and 1987-1988 into a less soil moisture category. Then, we examine the changes in the subsequent summer monsoon between these two groups.
 | Fig. 19. Year-to-year variations of the difference in area (20°N-50°N, 30°E-130°E) averaged DJFMA soil moisture content (cm) between CLSST_A and CLSST_B. |
Figure 20 displays the composite features of 200 mb circulation for the more and less soil moisture groups identified above. Obviously, the Asian monsoon becomes weaker following the increased soil moisture seasons (Fig. 20a) but changes less noticeably following the other category (Fig. 20b). This confirms the result shown in the last subsection with fewer samples.
 | Fig. 20. Composite patterns of the difference in 200 mb winds between CLSST_A and CLSST_B for the MJJAS of more (1983, 1986, and 1987; a) and less (1980, 1981, 1984, 1985, and 1988; b) soil moisture years. |
d. Precursory signals
The linkage between wet-cold land and weak monsoon can be understood better by studying the influence of land surface processes on the precursory signals of the monsoon. Figure 21 shows the changes in DJFMA 200 winds and 500 mb geopotential height associated with the more snow and soil moisture forcing illustrated in Figs. 16a-b. During the wet-cold seasons, the Asian westerly jet stream intensifies and shifts southward. Changes in 500 mb geopotential height exhibit a consistent pattern: the East Asian trough becomes stronger. The anomalous pattern of the pressure systems is accompanied by stronger cold temperature advection (not shown), which is consistent with the strong cooling of the subtropical Asian land- mass shown in Fig. 17b. In brief, an increase in snow and soil moisture alone can cause a stronger Asian westerly jet and a deeper East Asian trough, the two important features that precede a weaker summer monsoon.
 | Fig. 21. Composite patterns of the differences in DJFMA 200 mb winds (a) and 500 mb geopotential height (in m; b) between CLSST_A and CLSST_B during 1982-1983 and 1986-1987. |
An alternative way to demonstrate the direct impact of GW on the Asian summer monsoon is to apply the approach used by Yang et al. (1996) by analyzing results from CLSST_A alone because interannual variability of SST forcing has been excluded from this experiment. Figure 22 shows the DJFMA anomalies of snow mass and soil moisture prior to the summers of weakest monsoon in the experiment (1982 and 1983; see Fig. 23c later). The main feature is that more snow amount and soil moisture appear in the Asian continent before the weak monsoon. This is consistent with the result of Yang et al. but it demonstrates the relationship between the monsoon and land surface processes only. It can be seen from Fig. 23, which shows the seasonal patterns of 200 mb wind anomalies for DJF, MAM, and JJA for the weak monsoon years, that stronger-than-normal subtropical westerlies appear during the previous cold-seasons before the monsoon. Consistent with the feature shown in Fig. 21, the importance of land surface processes in the precursory signals of the Asian summer monsoon is demonstrated in Fig. 23.
 | Fig. 22. DJFMA anomalies of snow mass (a) and soil moisture content (b) prior to the two weakest monsoons (1982 and 1983) in CLSST_A. |
 | Fig. 23. Composite patterns of 200 mb wind anomalies for DJF, MAM, and JJA of the two weakest Asian monsoons (1982 and 1983) in CLSST_A. |
a. Summary
Using the Goddard Laboratory for Atmospheres general circulation model, we have performed a series of experiments to isolate the influences of SST and ground wetness (GW) on the Asian summer monsoon. We have identified the dominant signals associated with these influences and delineated the relative importance of each forcing function on the variability of the monsoon. Our results are summarized schematically in Fig. 24.
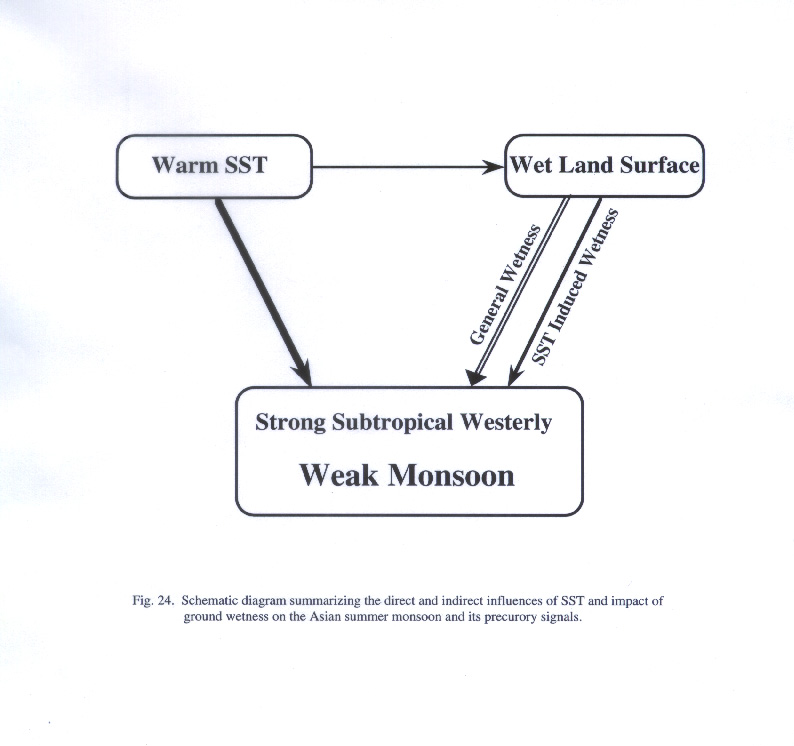 | Fig. 24. Schematic diagram summarizing the direct and indirect influences of SST and impact of ground wetness on the Asian summer monsoon and its precursory signals. |
Compared to GW variations, SST variability causes a more significant change in the Asian summer monsoon. For example, the reduction in MJJAS monsoon rainfall averaged within 10°N-25°N, 50°E-120°E is about 1 mm/day due to warm SST anomalies and 0.2 mm/day because of increased GW. The response of monsoon circulation is nonlinear with respect to warm and cold SST anomalies. The monsoon becomes significantly weaker during the warm events but changes relatively little during the cold events. This, however, might be the result of sampling errors because of the small number of cases used in the composite analysis. Associated with warm SST anomalies, both the Walker circulation and local Hadley circulation become weaker. Consistently, the amount of atmospheric water vapor transported into tropical Asia is reduced. We refer to this influence of summertime warm SST anomalies as SST's direct impact on the monsoon.
In the absence of SST's direct impact, the Asian summer monsoon becomes moderately weaker following wetter and colder seasons over the Asian continent. Land surface processes mainly affect the early stage of the monsoon. Results also indicate clearly that warm SST anomalies lead to increased soil moisture during the antecedent winter in the Asian continent which in turn affect the monsoon. We refer to this land surface influence which arises from the pre-monsoon warming of tropical central-eastern Pacific as SST's indirect impact on the Asian summer monsoon. Therefore, the influences of SST and GW on the Asian summer monsoon clearly involve mutually interactive processes. GW variations reinforce the Asian monsoon anomalies produced by warm SST forcing.
This study also shows clearly that both tropical SST and land surface processes are responsible for the variations of the winter-spring westerlies over subtropical Asia, precursory signals for the Asian summer monsoon.
b. Further remarks
The results of this study have elucidated some possible mechanisms of monsoon variability and potentials for improving skills in seasonal-to-interannual monsoon predictions. However, many issues on the subject still remain uncertain. Because the change in SST forcing has been made globally in our experiments, we are unable to assess the importance of regional SST in monsoon variability. Although the extratropical oceans may play only a minor role in governing the short-term variability of the Earth's climate (e.g., Lau and Nath 1994), the change in tropical western Pacific SST is sometimes important (Soman and Slingo 1997). There are even more uncertainties in the role of the Indian Ocean in the variability of the Asian monsoon (Palmer et al. 1992; Nigam 1994; Zhu and Houghton 1996; and Soman and Slingo 1997). Whether the ocean plays an active (forcing) or passive (response) role in the monsoon and to what extent the ocean influences the monsoon system are unclear. Additional GCM experiments are needed to investigate the association between the Indian Ocean and Asian monsoon.
Difficulties also exist in representing the changes in land surface processes, as mentioned in the introduction. These difficulties can be serious because there are many ways to modify land surface processes in GCMs and, to a large extent, the nature of monsoon response depends on these modifications. Changes in land surface forcing have been made in snow mass (e.g., Barnett et al. 1989), evaporability (Lau and Bua 1997), and soil moisture content as in this paper. Yet all these changes influence the following summer monsoon through the variations in surface temperature. Thus, it seems that modification of land surface forcing should be made in model surface temperature. However, the temperature field is sensitive to the feedback of atmospheric circulation especially during summer when monsoon rainfall modifies surface temperature on very short time scales. Therefore, it is very difficult to treat land surface processes in an appropriate but simple way. In this study, in order to isolate the impact of snow and soil moisture from the influence of SST, we have specified in CLSST_A the snow and soil moisture using the daily values generated by AMIP. However, whether these daily data are appropriate as a forcing function is questionable.
One implication of the present result is that the response of the Asian summer monsoon to SST and land surface forcings is more impressive when the system is in a weak but not in a vigorous state. When the monsoon is strong, it tends to maintain its robust mode and is less vulnerable to the effect of external forcings. This conjecture has been supported by the studies of Yasunari (1990), Webster and Yang (1992), Lau and Yang (1996b), and Wainer and Webster (1996).
The variability of the Asian summer monsoon associated with the Earth's surface forcing involves many complex processes on a variety of time scales. This study focuses only on monsoon's seasonal-to-interannual variations. Undoubtedly, a better understanding of monsoon variations on other time scales (e.g., intraseasonal and interdecadal) is also of great importance, both scientifically and economically. For example, the intraseasonal variability of the Asian monsoon is characterized by chaotic features (Palmer 1994; Webster 1996) which affect monsoon forecasts in important but yet unknown ways. The linkage between monsoon's intraseasonal variation and surface boundary forcing is an important subject for further investigations.
Chen, T.-C., and M.-C. Yen, 1994: Interannual variation of the Indian monsoon simulated by the NCAR community climate model: Effect of the tropical Pacific SST. J. Climate, 7, 1403-1415.
Dong, B., and P. J. Valdes, 1997: Asian and Indian summer monsoon rainfall and Eurasian winter/spring snow mass. Quart. J. Roy. Meteor. Soc., submitted.
Douville, H., and J.-F. Royer, 1996: Sensitivity of the Asian summer monsoon to an anomalous Eurasian snow cover within the Meteo_France GCM. Climate Dynamics, 12, 449-466.
Hoering, M. P., A. Kumar, M. Zhong, 1997: El Niño, La Niña, and the nonlinearity of the teleconnections. J. Climate, 10, in press.
Ju, J., and J. Slingo, 1995: The Asian summer monsoon and ENSO. Quart. J. Roy. Meteor. Soc., 121, 1133-1168.
Keshavamurty, R. N., 1982: Response of the atmosphere to sea temperature anomalies over the equatorial Pacific and the teleconnections of the Southern Oscillation. J. Atmos. Sci., 39, 1241-1259.
Kitoh, A., 1992: Simulated interannual variations of the Indo-Australian monsoons. J. Meteor. Soc. Japan, 70, 563-583.
Latif, M., A. Sterl, M. Assenbaum, M. M. Junge and E. Maier-Reimer, 1994: Climate variability in a coupled GCM. Part II: The Indian Ocean and monsoon. J. Climate, 7, 1449-1462.
Lau, K.-M. and W. R. Bua, 1997: Effects of land surface processes, SST and internal dynamics on monsoon - Southern Oscillation coupling: Insights from preliminary GCM experiments. J. Climate, submitted.
Lau, K.-M., and M. T. Li, 1984: The monsoon of east Asia and its global association. Bull. Amer. Meteor. Soc., 65, 114-125.
Lau, K.-M., Y. C. Sud and J.-H. Kim, 1996: Intercomparison of hydrologic processes in AMIP GCMs. Bull. Amer. Meteor. Soc., 77, 2209-2227.
Lau, K.-M. and S. Yang, 1996: Seasonal variation, abrupt transition and intraseasonal variability associated with the Asian summer monsoon in the GLA GCM. J. Climate, 9, 965-985.
Lau, K.-M. and S. Yang, 1997: Climatology and interannual variability of the Southeast Asian monsoon. Adv. Atmos. Sci., in press.
Lau, N.-C., and M. J. Nath, 1994: A modeling study of the relative roles of tropical and extratropical SST anomalies in the variability of the global atmosphere- ocean system. J. Climate, 7, 1184-1207.
Li, C., and M. Yanai, 1996: The onset and interannual variability of the Asian summer monsoon and relation to land-sea thermal contrast. J. Climate, 9, 358- 375.
Meehl, G. A., 1994a: Influence of the land surface in the Asian summer monsoon: External conditions versus internal feedbacks. J. Climate, 7, 1033-1049.
Meehl, G. A., 1994b: Coupled land-ocean-atmosphere processes and South Asian monsoon variability. Science, 266, 263-267.
Meehl, G. A., 1997: The South Asian monsoon and the tropospheric biennial oscillation. J. Climate, in press.
Nagai, T., Y. Kitamur, M. Endoh and T. Tokioka, 1995: Coupled atmosphere-ocean model simulations of El Niño/Southern Oscillation with and without an active Indian Ocean. J. Climate, 8, 3-14.
Nigam, S., 1994: On the dynamical basis for the Asian summer monsoon rainfall - El Niño relationship. J. Climate, 7, 1750-1771.
Palmer, T. N., 1994: Chaos and the predictability in forecasting the monsoons. Proc. Indian Natr. Sci. Acad., 60A, 57-66.
Palmer, T. N., C. Brankovic, P. Viterbo and M. J. Miller, 1992: Modeling interannual variations of summer monsoons. J. Climate, 5, 399-417.
Philander, S. G., 1990: El Niño, La Niña, and the Southern Oscillation. Academic Press, Inc., 293 pp.
Rasmusson, E. M., and T. H. Carpenter, 1982: Variations in tropical sea surface temperature and surface wind fields associated with the Southern Oscillation/El Niño. Mon. Wea. Rev., 110, 354-384.
Schemm, J., S. Schubert, J. Terry and S. Bloom, 1992: Estimates of monthly mean soil moisture for 1979-1989. NASA Tech. Memo., No. 104571, 252 pp.
Shukla, J., 1975: Effect of Arabian Sea surface temperature anomaly on Indian summer monsoon: A numerical experiment with the GFDL model. J. Atmos. Sci., 32, 503-511.
Soman, M. K., and J. Slingo, 1997: Sensitivity of Asian summer monsoon to aspects of sea surface temperature anomalies in the tropical Pacific Ocean. Quart. J. Roy. Meteor. Soc., 123, 309-336.
Spencer, R. W., 1993: Global oceanic precipitation from the MSU during 1979-1991 and comparisons to other climatologies. J. Climate, 6, 1301-1326.
Sud, Y. C., and G. K. Walker, 1993: A rain evaporation and downdraft parameterization to complement a cumulus updraft scheme and its evaluation using GATE data. Mon. Wea. Rev., 121, 3019-3039.
Vernekar, A. D., J. Zhou and J. Shukla, 1995: The effect of Eurasian snow cover on the Indian monsoon. J. Climate, 8, 248-266.
Wainer, I, and P. J. Webster, 1996: Monsoon/El Niño-Southern Oscillation relationships in a simple coupled ocean-atmosphere model. J. Geophys. Res., 101, 25,599-25,614.
Wang, B., 1992: The vertical structure and development of the ENSO anomaly mode during 1979-1989. J. Atmos. Sci., 49, 698-712.
Washington, W. M., R. M. Chervin and G. V. Rao, 1977: Effects of a variety of Indian Ocean surface temperature anomaly patterns on the summer monsoon circulation: Experiments with the NCAR general circulation model. Pageoph, 115, 1335-1356.
Webster, P. J., 1996: Intraseasonal variability of the coupled monsoon system and its relationship to predictability of climate. Proceedings of International Workshop on the Climate System of Monsoon Asia, 3-7 December 1996, Kyoto, Japan, 14-17.
Webster, P. J., and S. Yang, 1992: Monsoon and ENSO: Selectively interactive systems. Quart. J. Roy. Meteor. Soc., 118, 877-926.
Yang, S., 1996: ENSO-snow-monsoon associations and seasonal-interannual predictions. Int. J. Climatol., 16, 125-134.
Yang, S., K.-M. Lau and M. Sankar-Rao, 1996: Precursory signals associated with the interannual variability of the Asian summer monsoon. J. Climate, 9, 949-964.
Yang, S., and P. J. Webster, 1990: The effect of summer tropical heating on the location and intensity of the extratropical westerly jet streams. J. Geophys. Res., 95, D11, 19705-18721.
Yasunari, T., 1990: Impact of Indian monsoon on the coupled atmosphere/ocean system in the tropic Pacific. Meteor. Atmos. Phys., 44, 29-41.
Yasunari, T., A. Kitoh and T. Tokioka, 1991: Local and remote responses to excessive snow mass over Eurasia appearing in the northern spring and summer climate -- A study with the MRI GCM. J. Meteor. Soc. Japan, 69, 473-487.
Yeh, T. C., R. T. Wetherald and S. Manabe, 1984: The effect of soil moisture on the short-term climate and hydrology change - a numerical experiment. Mon. Wea. Rev., 112, 474-490.
Zhu, Y., and D. D. Houghton, 1996: The impact of Indian Ocean SST on the large- scale Asian summer monsoon and the hydrological cycle. Int. J. Climatol., 16, 617-632.
Zwiers, F. W., 1993: Simulation of the Asian summer monsoon with the CCC GCM-1. J. Climate, 6, 470-486.
Drs. Song Yang and K.-M. Lau