![\begin{displaymath}
J = \sum_{\sigma, \tau, i}^{} \Big[ \eta_v (v_{ri} - v_{ri}^...
...um_{\sigma}^{} \eta_b \Big[ (u-u_b)^2 + (v - v_b)^2 \Big]~+~J_p\end{displaymath}](img1.gif)
| Download Postscript File | Download Compressed Postscript File |
Juanzhen Sun
National Center for Atmospheric Research, Boulder, Colorado, USA
1. Introduction
Since the deployment of the WSR-88D network, active researches have been undertaken to infer low-level wind information from single-Doppler radars. Most of the methods rely on the assumption that reflectivity (or radial velocity) acts as a tracer in the flow and hence can be tracked to determine the flow field (Tuttle and Foote 1990, Qiu and Xu 1992, Laroche and Zawadsky 1993, Shapiro et al. 1995, Gal-Chen and Zhang 1993, Xu et al. 1994). More sophisticate methods use the full set of equations and the 4-dimensional variational technique to fit the dynamical model to the time series of observations (Sun et al. 1991, Sun and Crook 1994). The 4-D variational technique can retrieve not only the 3-D wind but also the temperature field. Recently, the Variational Doppler Radar Analysis System (VDRAS), an extension of the adjoint system used in Sun and Crook (1994), has been further developed and applied to real-time WSR-88D radar wind analysis at Sterling, Virginia. In this paper, we will describe the recent development of VDRAS and show some results from the real-time experiment.
2. The VDRAS Technique and Recent Development
VDRAS was designed to assimilate a time series of radar observations (radial velocity and reflectivity) from single or multiple Doppler radars. A numerical model is used to represent the evolution of the motion in the dry boundary layer. Based on the anelastic approximation, the numerical model includes 4 prognostic variables, i. e., the three velocity components (u, v, and w), and the potential temperature (q). The pressure (p) is diagnosed through the Poisson equation. In order to assimilate the reflectivity data, an additional equation, the conservation equation for reflectivity (Z), is included in the numerical model. By fitting the model to observations over a specified time period, a set of optimal initial conditions of the constraining numerical model can be obtained. A cost function, that measures the misfit between the model variables and the observations, is defined as
|
(1) |
| (2) |
In order for VDRAS to be implemented in the real-time experiment in the summer of 1998, the system was further developed. Three major improvements was added:
VDRAS was run on a 533 MHz DEC Alpha-Linux PC in the summer of 1998 at Sterling, Virginia. The assimilation window was set to 12 minutes. In the storm mode, there were generally three radar data volumes within this assimilation window. In the clear air mode, there were two volumes. The grid resolution is 2 km in the horizontal and 375 m in the vertical with a grid mesh of 50x50x10. Each analysis took less than 11 minutes (40 iterations).
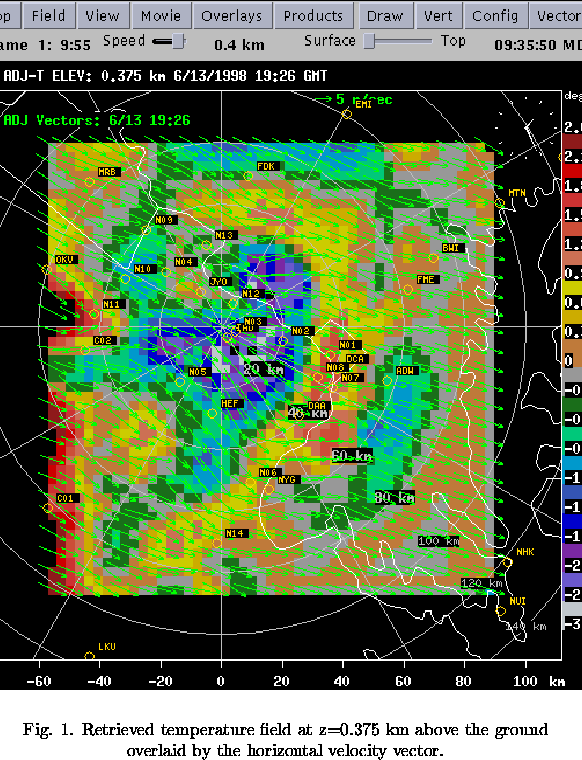
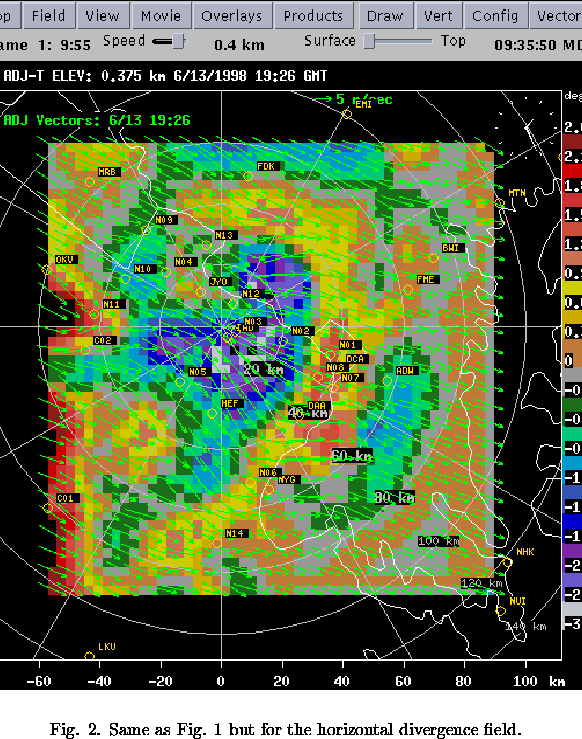
During the summer of 1998, the WSR-88D at Sterling, Virginia observed several events of severe storms. Most of them were associated with strong boundary layer convergence zones. VDRAS was able to retrieve these convergence lines which could help the forecaster in their decision making of severe weather warning issue. Fig. 1 shows an example of the low level wind analysis using VDRAS and data from the WSR-88D radar located at Sterling. The event occurred in the afternoon of June 13, 1998. A squall line type of storms developed along a strong convergence zone. Figs. 1 and 2 show the retrieved temperature and horizontal divergence fields both overlaid by the velocity vectors. The figures clearly show the position of the convergence line.
3. Conclusions
The variational Doppler radar analysis system based on the adjoint method was described and results from the real-time application in the summer of 1998 in Starling, VA was shown. This system can provide dynamical consistent real-time 3-D wind and temperature analysis fields. These detailed analysis fields can be used by forecasters to issue severe weather warning and in numerical weather prediction.
References
Gal-Chen, T., and J. Zhang, 1993: On the optimal use of reflectivities and single Doppler radar velocities to deduce 3D motions. Preprints, 26th Int. Conf. on Radar Meteorology, Norman, OK, Amer. Meteor. Soc., 414-416.
Laroche, S., and I. Zawadsky, 1993: Echo tracking bt three variational analysis methods. Preprints, 26th Int. Conf. on Radar Meteorology, Norman, OK, Amer. Meteor. Soc., 438-440.
Qiu, C.-J., and Q. Xu, 1992: A simple adjoint method of wind analysis for single-Doppler data. J. Atmos. Oceanic Technol., 9, 588-598.
Shapiro, A, E. Ellis, and J. Shaw, 1995: Single-Doppler velocity retrievals with Phoenix II data: Clear air and microburst retrievals in one planetary boundary layer. J. Atmos. Sci., 52, 1265-1287.
Sun, J, and A. Crook, 1994: Wind and thermodynamic retrieval from single-Doppler measurements of a gust front observed during Phoenix II. Mon. Wea. Rev., 122, 1075-1091.
Sun, J, D. W. Flicker, and D. K. Lilly, 1991: Recovery of three dimensional wind and temperature fields from simulated Doppler radar data. J. Atmos. Sci., 48, 876-890.
Tuttle, J. D., and G. B. Foote, 1990: Determination of the boundary layer airflow from a single-Doppler radar. J. Atmos. Oceanic Technol., 7, 218-232.
Xu, Q., C. Qiu, and J. Yu, 1994: Adjoint method retrieving of horizontal winds from single-Doppler reflectivity measured during Phoenix II. J. Atmos. Oceanic Technol., 11, 275-288.
Corresponding Author: