![]()
| CG Project |
| Cloud-to-ground flash rate and mapping |
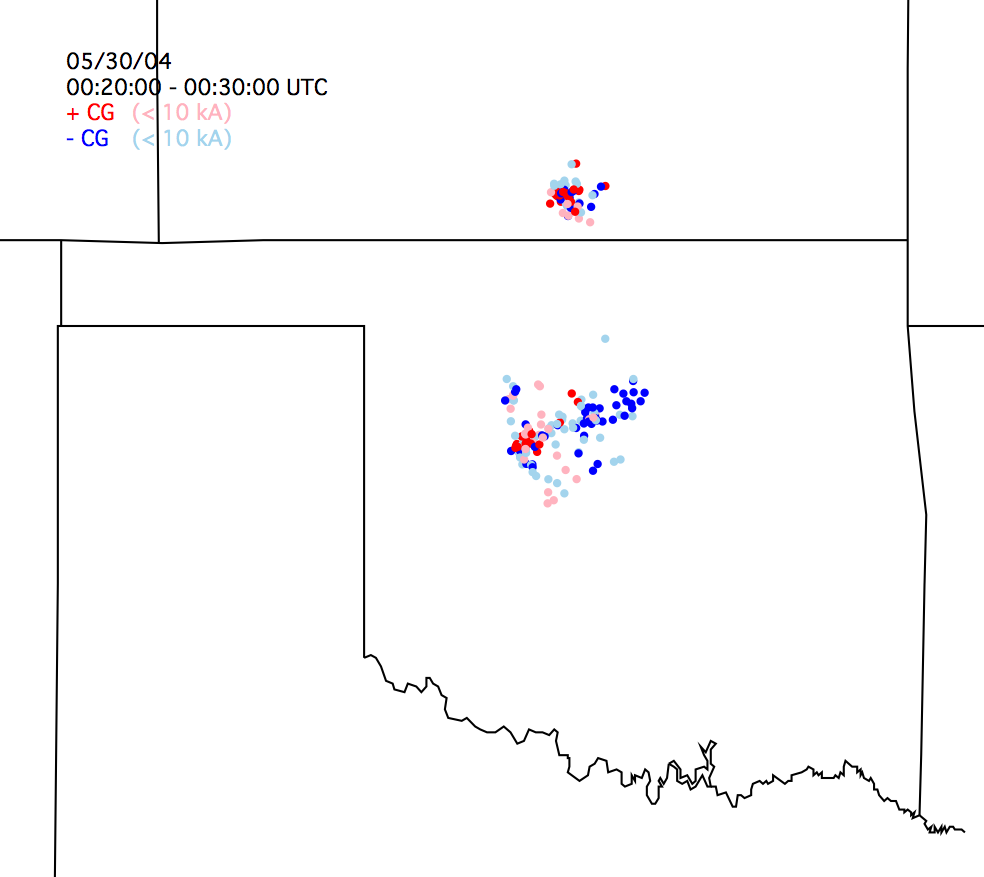
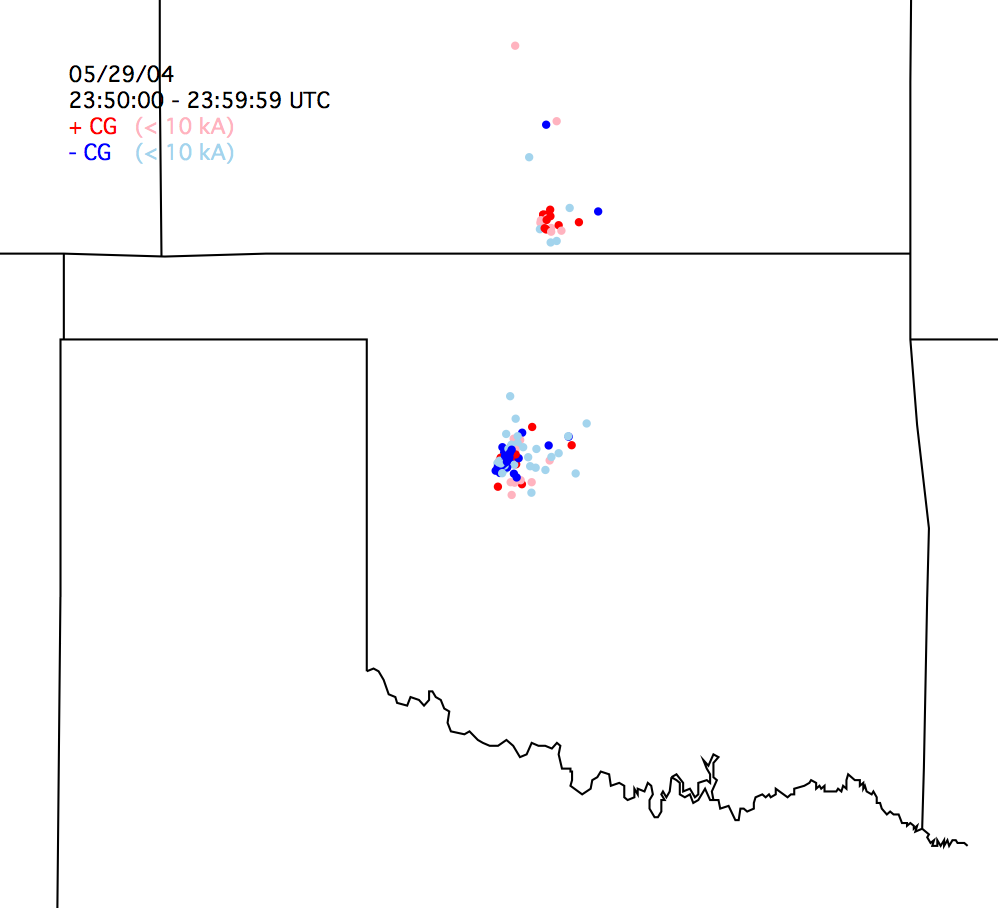
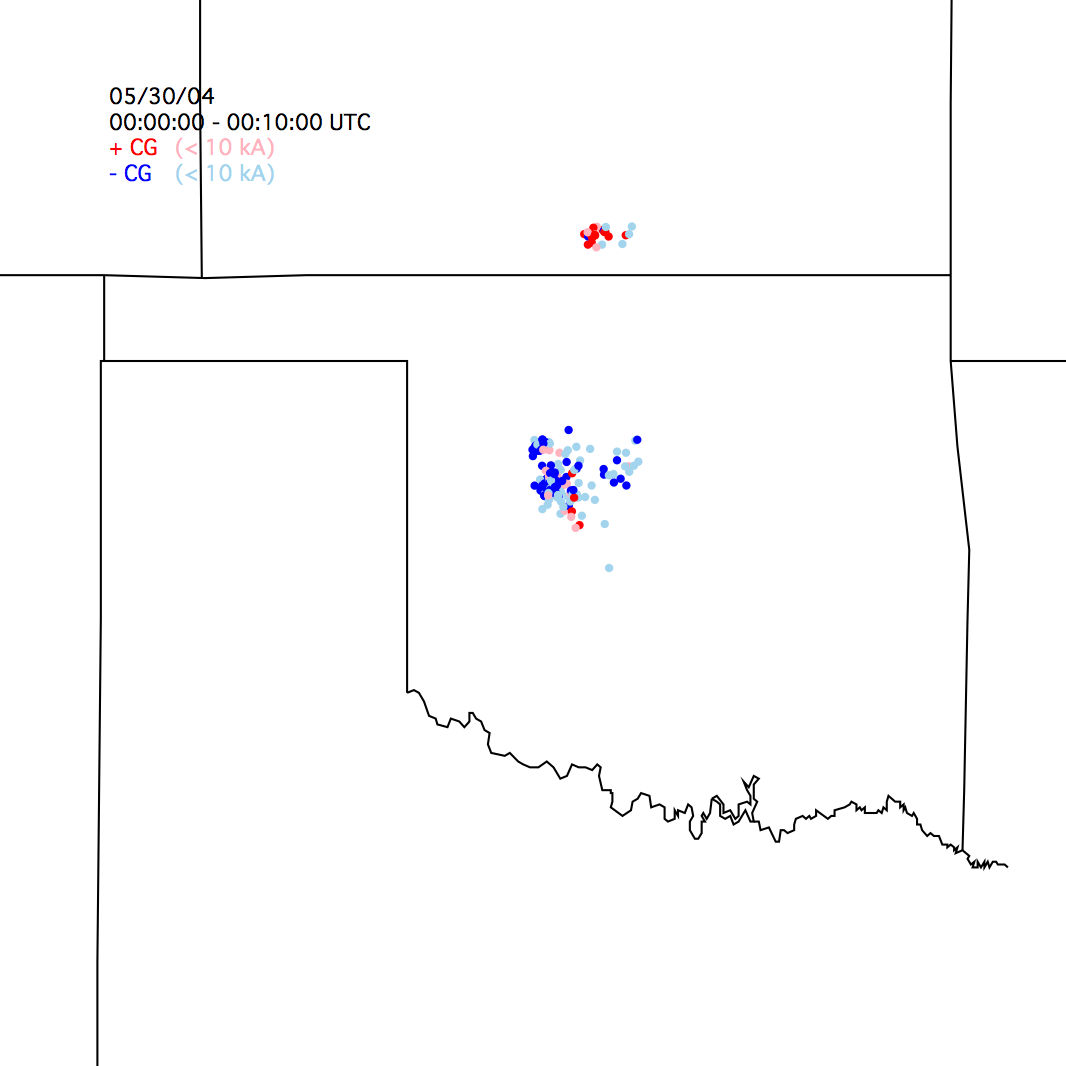
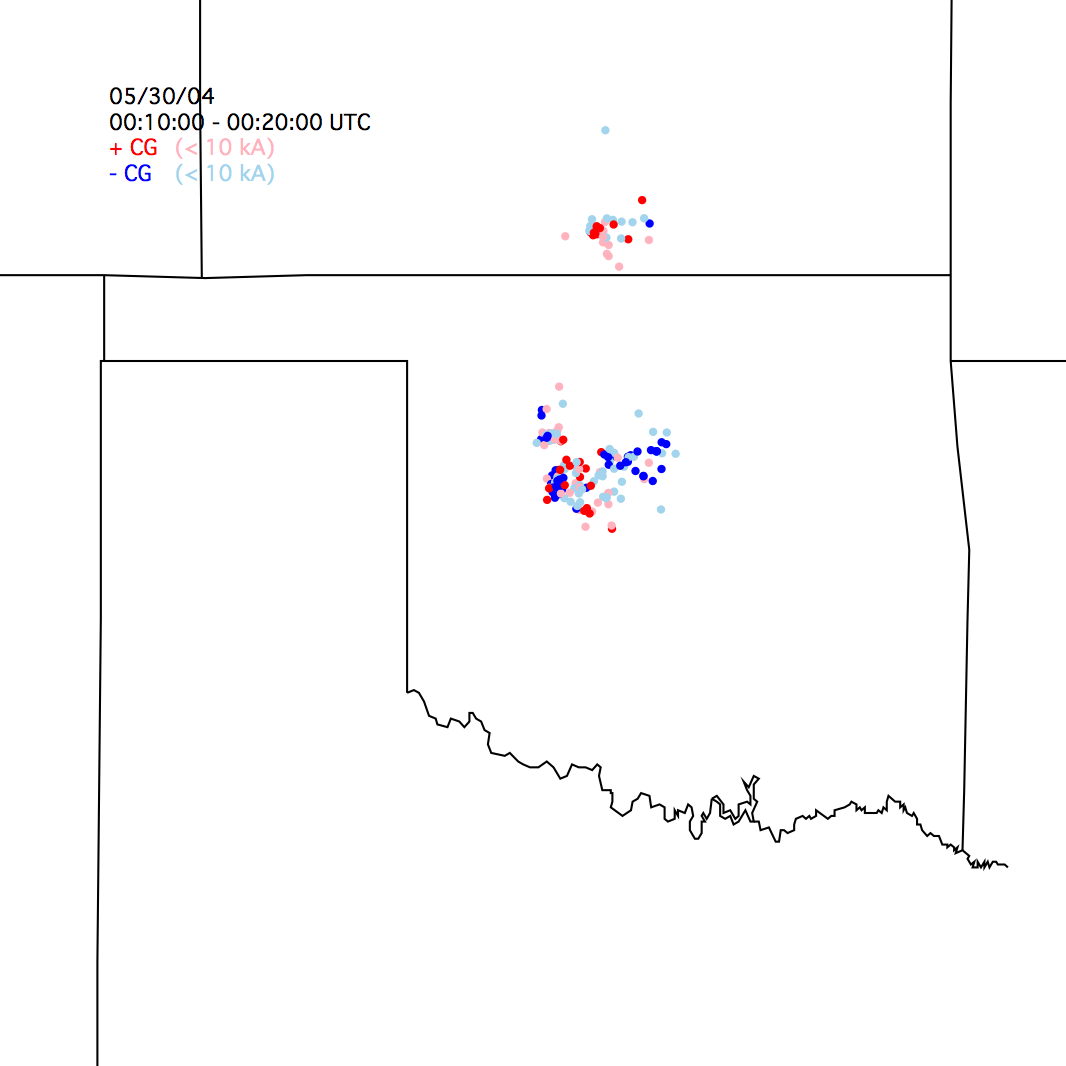
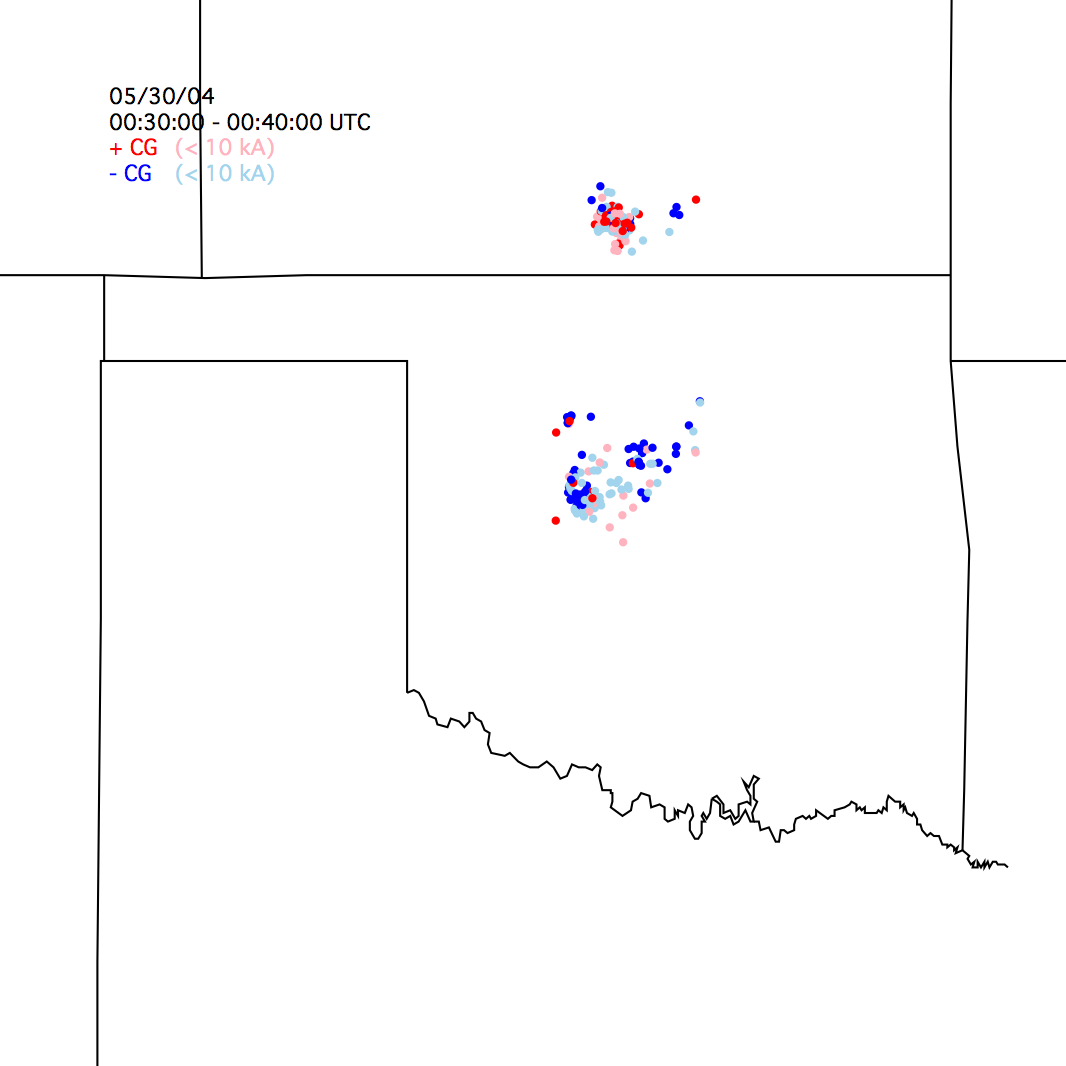
NLDN CG strike locations for positive (red) and negative (blue) CG flashes on 29 May 2004 from 00:20 - 00:30 UTC. Pink and Light Blue circles represent CG strikes of less than 10 kA (typically, CG flashes of less than 10 kA detected by the NLDN are not actual CG flashes but misclassified in-cloud flashes).
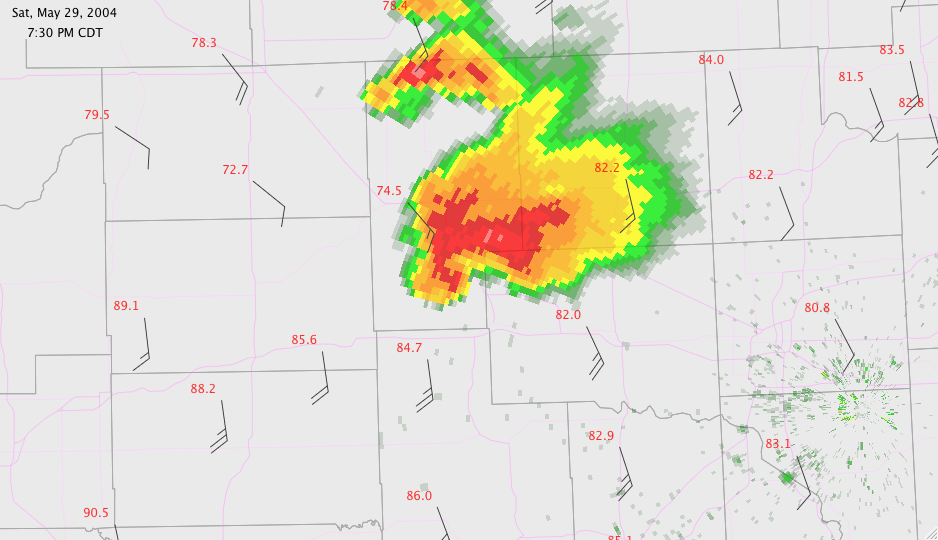
KTLX WSR-88D Reflectivity of supercell storm in central Oklahoma at corresponding time to above CG map. 10 m winds, and air temperature from Oklahoma Mesonet at 00:30 UTC. Plotted using weatherscope from OCS.
Intrestingly, we see that as the 29 May 2004 storm progresses in time there is a dominance of positive CG flashes from the core of the storm and negative CG flashes from the anvil. Then as the storm reaches the OKC area negative CG flashes are again dominant throughout the storm (see the 00:30 - 00:40 UTC 30 May 2004 time period). This was not at all expected from this HP supercell in this area of the country. Further research will be done!
Scripts used for cg mapping:
pickle
CG map
example of NLDN data for 30 May 2004
Here are some links to other times that have been plotted:
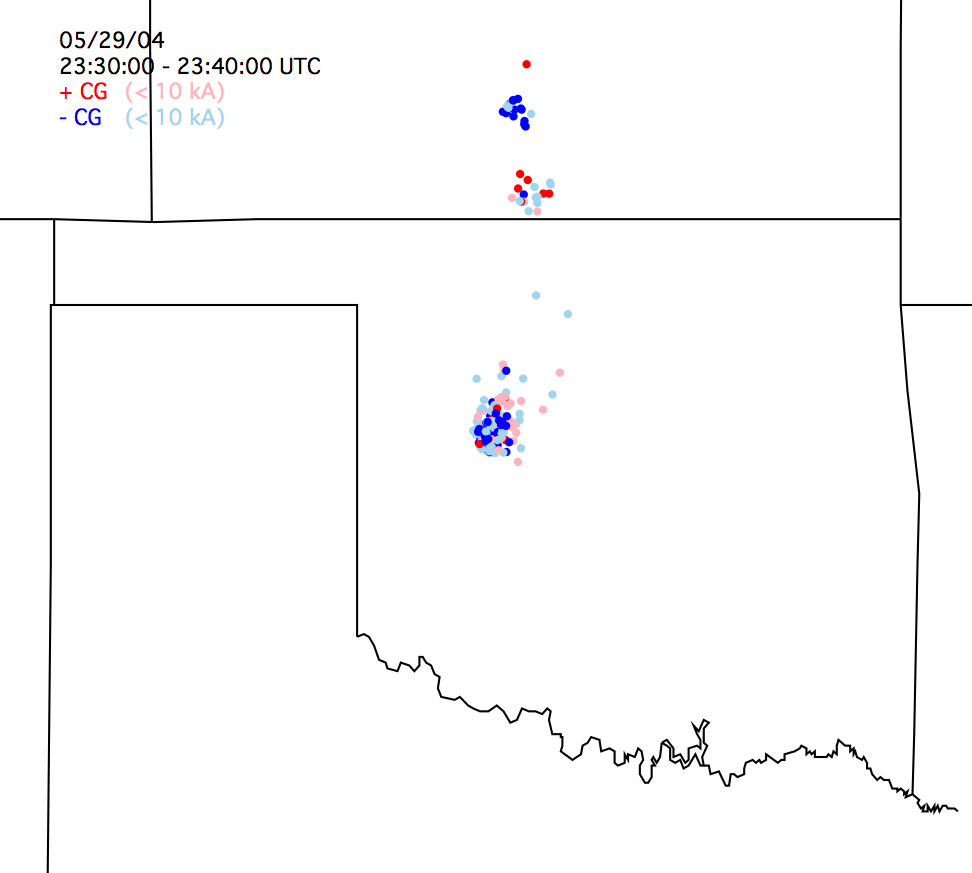
23:30 - 23:40 UTC, 29 May 2004
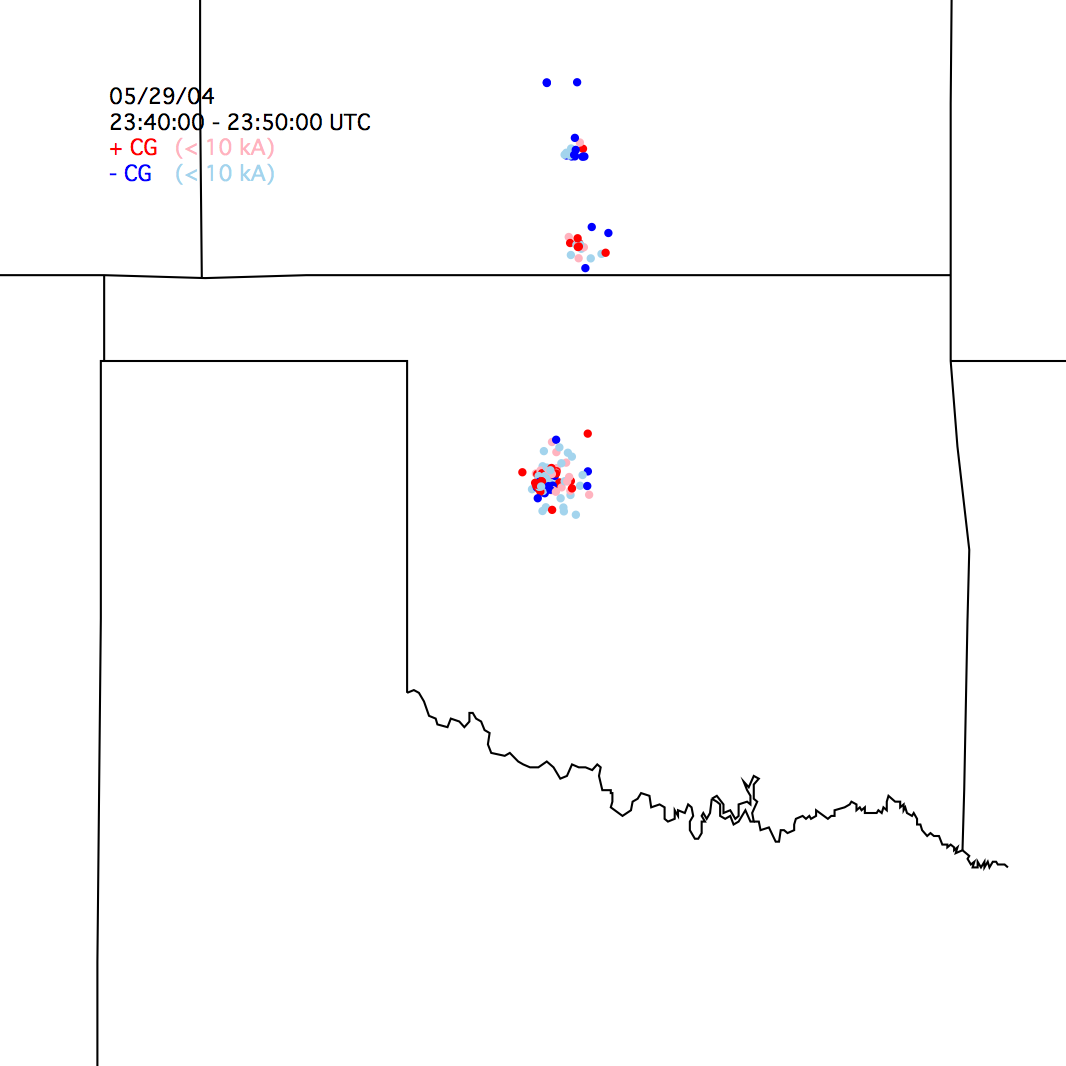
23:40 - 23:50 UTC
23:50 - 00:00 UTC
00:00 - 00:10 UTC
00:10 - 00:20 UTC
00:30 - 00:40 UTC
Scripts used for CG flash rate:
python script
text output, 1 min CG flash rate from 00:00 UTC - 00:30 UTC
CG flashrates for 29 May 2004 (10 min periods):
| Time |
All CGs
(+ & -) |
neg. CGs |
neg. lt 10 kA |
pos. CGs |
pos. lt 10 kA |
+ & - CGs
greater than 10 kA |
| 23:30 - 23:40 |
171 |
131 |
67 |
40 |
30 |
74 |
| 23:40 - 23:50 |
106 |
55 |
34 |
51 |
20 |
52 |
| 23:50 - 00:00 |
96 |
69 |
35 |
27 |
11 |
50 |
| 00:00 - 00:10 |
206 |
181 |
65 |
25 |
19 |
122 |
| 00:10 - 00:20 |
169 |
118 |
54 |
51 |
33 |
88 |
| 00:20 - 00:30 |
142 |
98 |
50 |
44 |
24 |
68 |
| 00:30 - 00:40 |
136 |
106 |
46 |
30 |
19 |
71 |
To Metr5330 work
BACK TO MY MAIN PAGE
| 