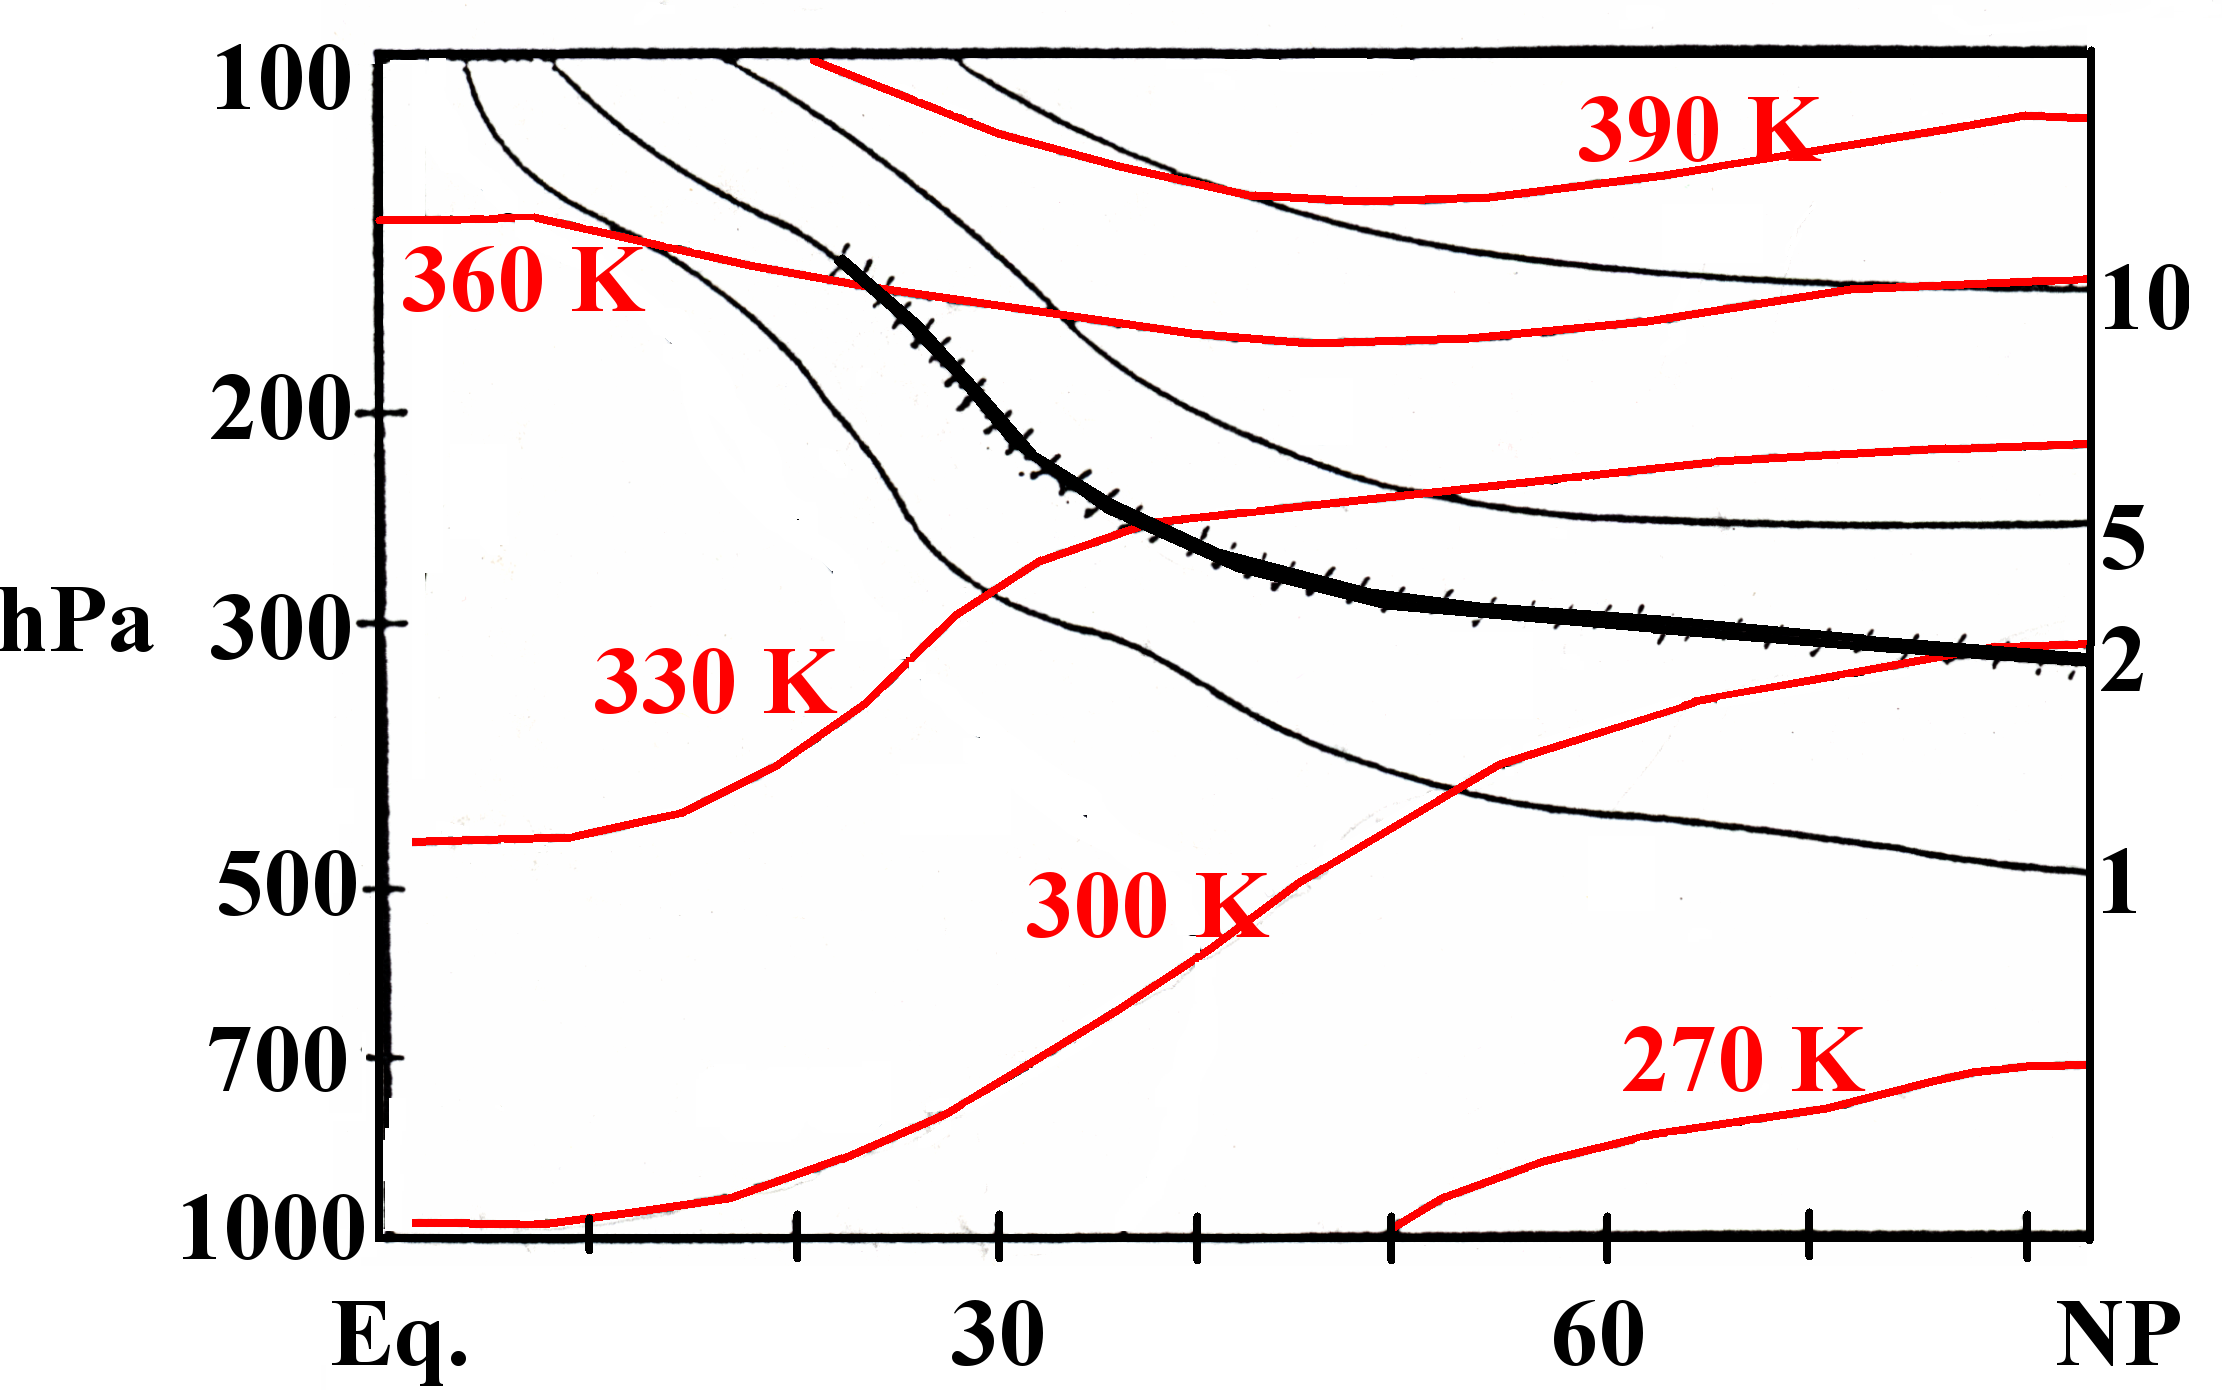
The "Dynamic tropopause". The black lines represent lines of constant Ertel
potential vorticity while the red lines represent lines of constant potential
temperature (theta). The "Dynamic tropopause" is represented by the bold
black line, and in this diagram is the 2 PVU surface. 1 PVU is 1 x
10^{-6} K kg^{-1} s^{-1} m^2. Values on the ordinate are pressure with units of millibars and on the absicsa is degrees
latitude (Hoskins 1990*).
*Hoskins, B.J., 1990: Theory of extratropical cyclones. Chapter 5 of
Extratropical Cyclones: The Erik Palmen Memorial Volume, Amer. Meteor.
Soc., 63-80.
|