|
Research
|
Tropical Cyclones
|
Field Observations
|
About me
|
Weather Briefing
|
|
Last updated:
Tue 19 December 2006 3:49 p.m. CET
|
|
|
Tropical Cyclone Climatology Plotter
|
|
|
Plot your own Atlantic hurricane motion climatology |
Plotting CGI script updated 8-10-04. Thank you for your interest! Significant bugs still exist with this script; please bear with me as I work them out. A few suggestions:
(1) Use latest version of Internet Explorer.
(2) Enable pop-ups for this site as the image will appear in a new window.
(3) Do not reload the "popped-up" page. To plot a new image, simply return to this page.
(4) Clear the browser cache if the image doesn't seem to change.
(5) Please email me (link below) with any problems you are still experiencing.
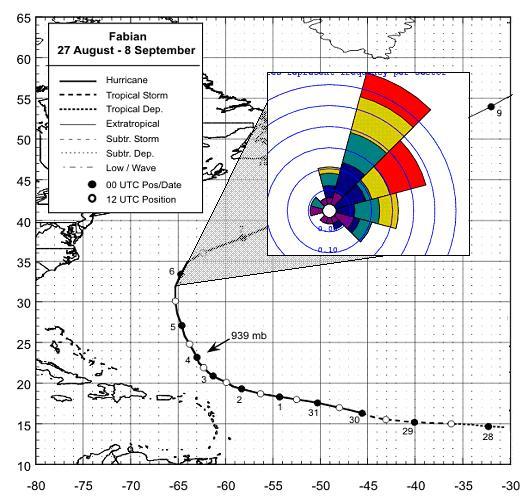
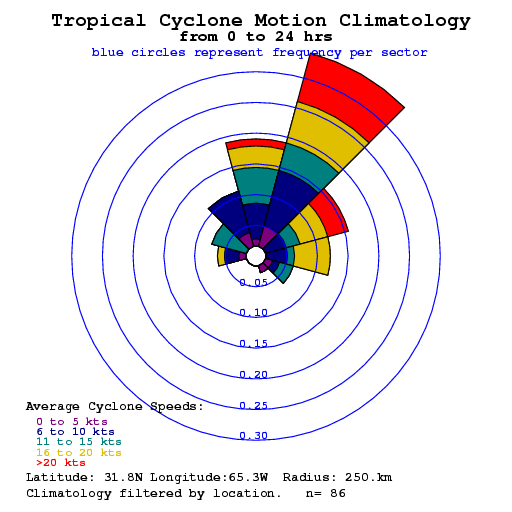
Here is an example of the motion climatology for Hurricane Fabian (2003). The figure represents the percentage of tropical cyclones that moved in a given direction (length of each sector) with a given speed (length of each colorized sub-sector). The climatology is created from all tropical cyclones in the last 33 years (1970-2002) located within 250 km of 31.8N 65.3W.
First I apologize for the very crude interface and display mechanism for this data. I realize that this page has gotten several "official" visitors (NOAA/NWS forecasters, tropical cyclone specialists, university professors, etc), and I want to be able to showcase what I consider to be a very exciting display of this very useful data. Please bear with me as I update the graphical interface. As of late summer 2004, I am focusing most of my energy on studying for the PhD qualifying exam at the Univ. of Okla., but I do hope to get to spend some time updating the scripts. If you find any problems with this site, please email me (link below). Thanks for your patience!
|
|
|
|